Security Analytic Dashboards
Work Overview • Desktop • Visualizations
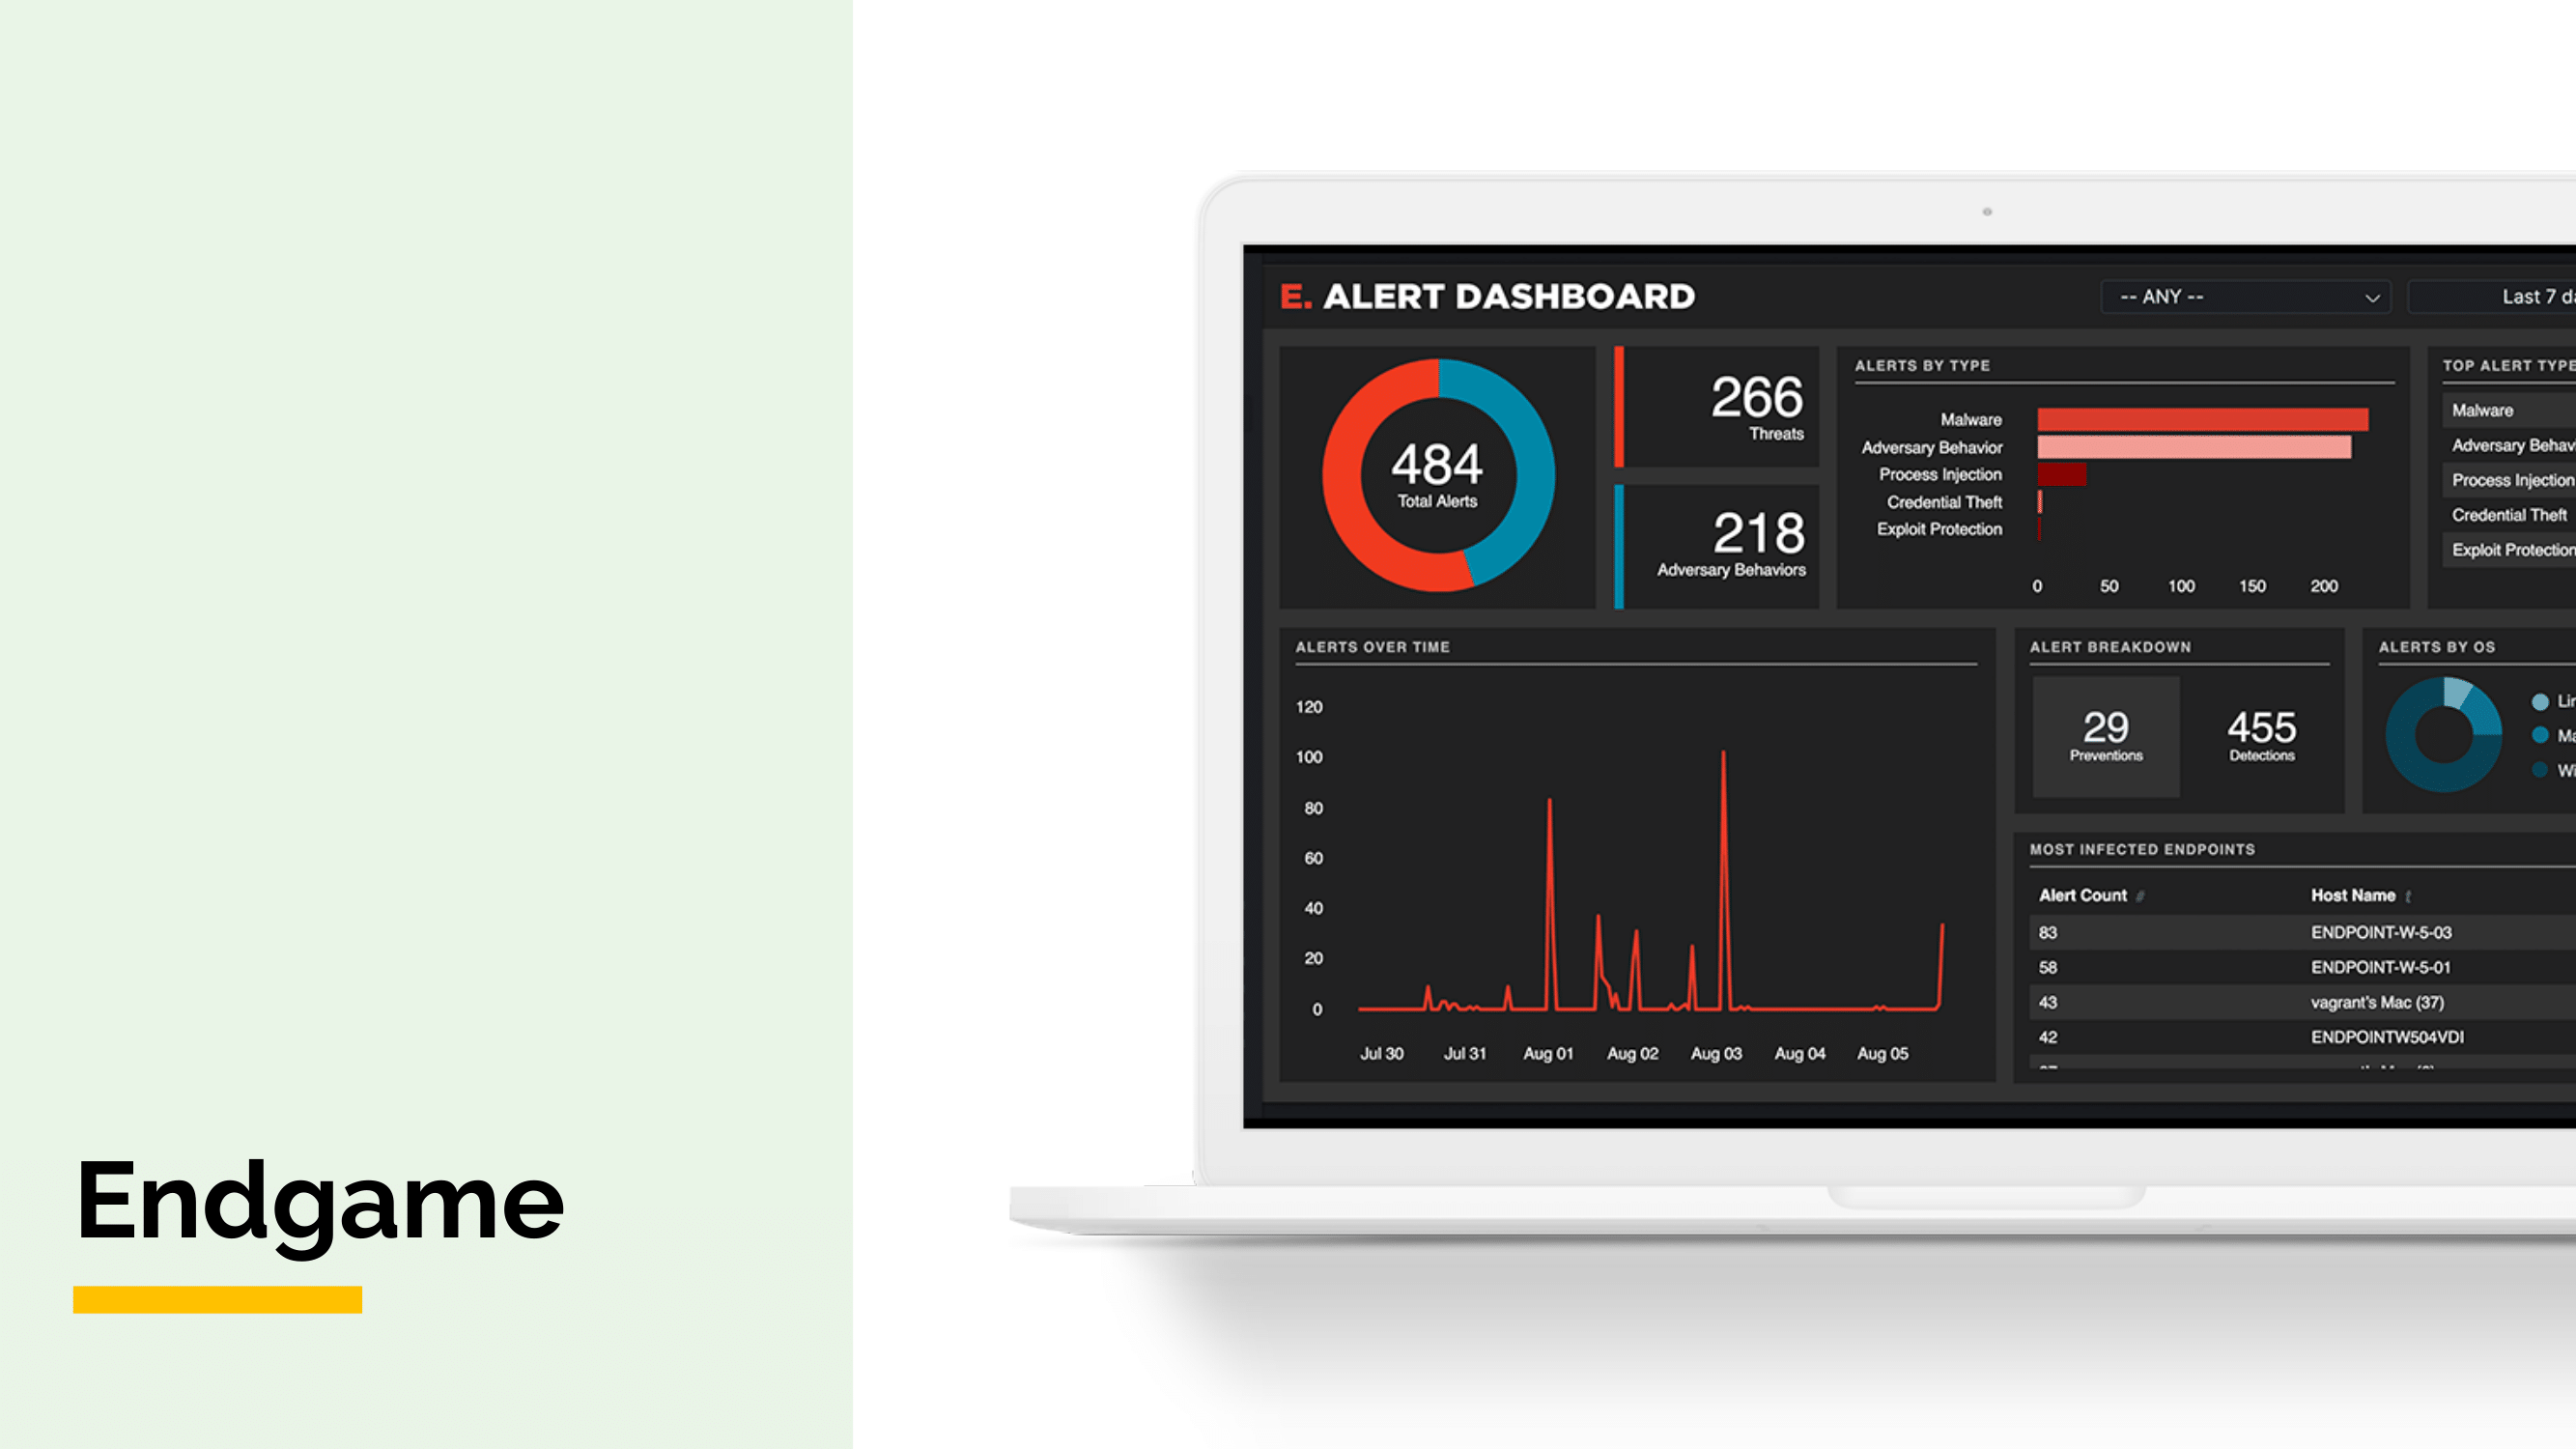
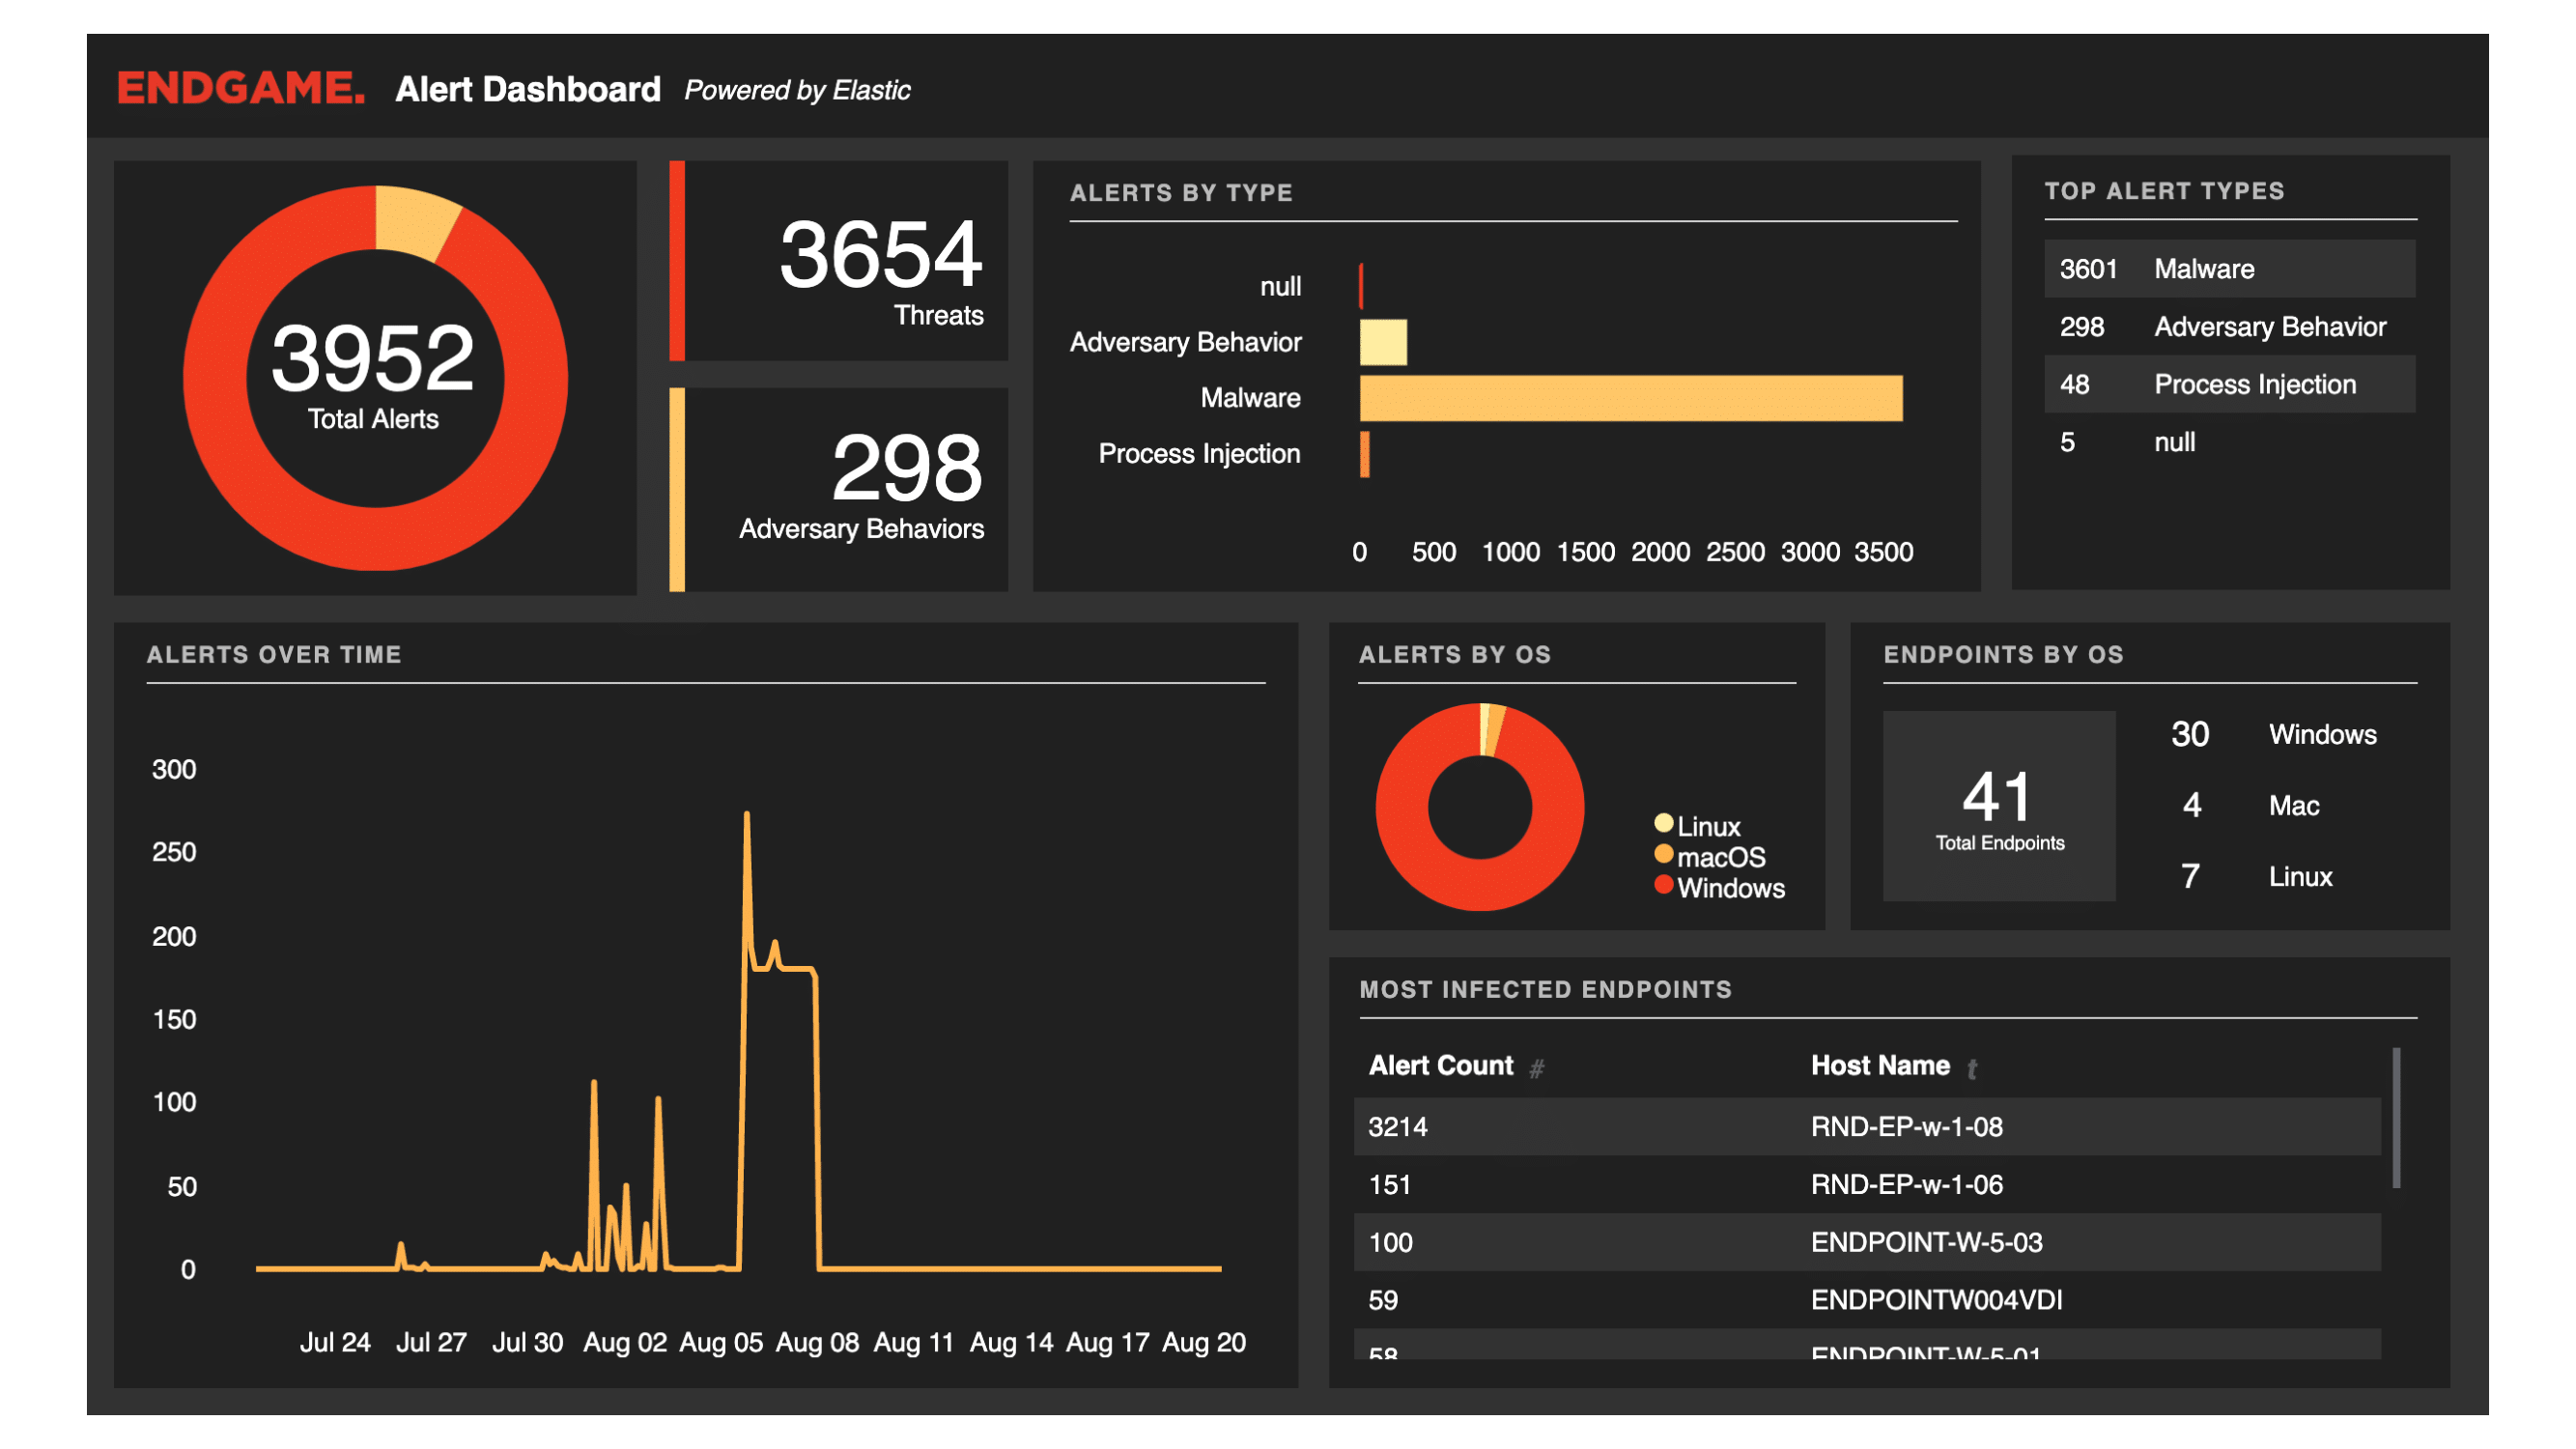
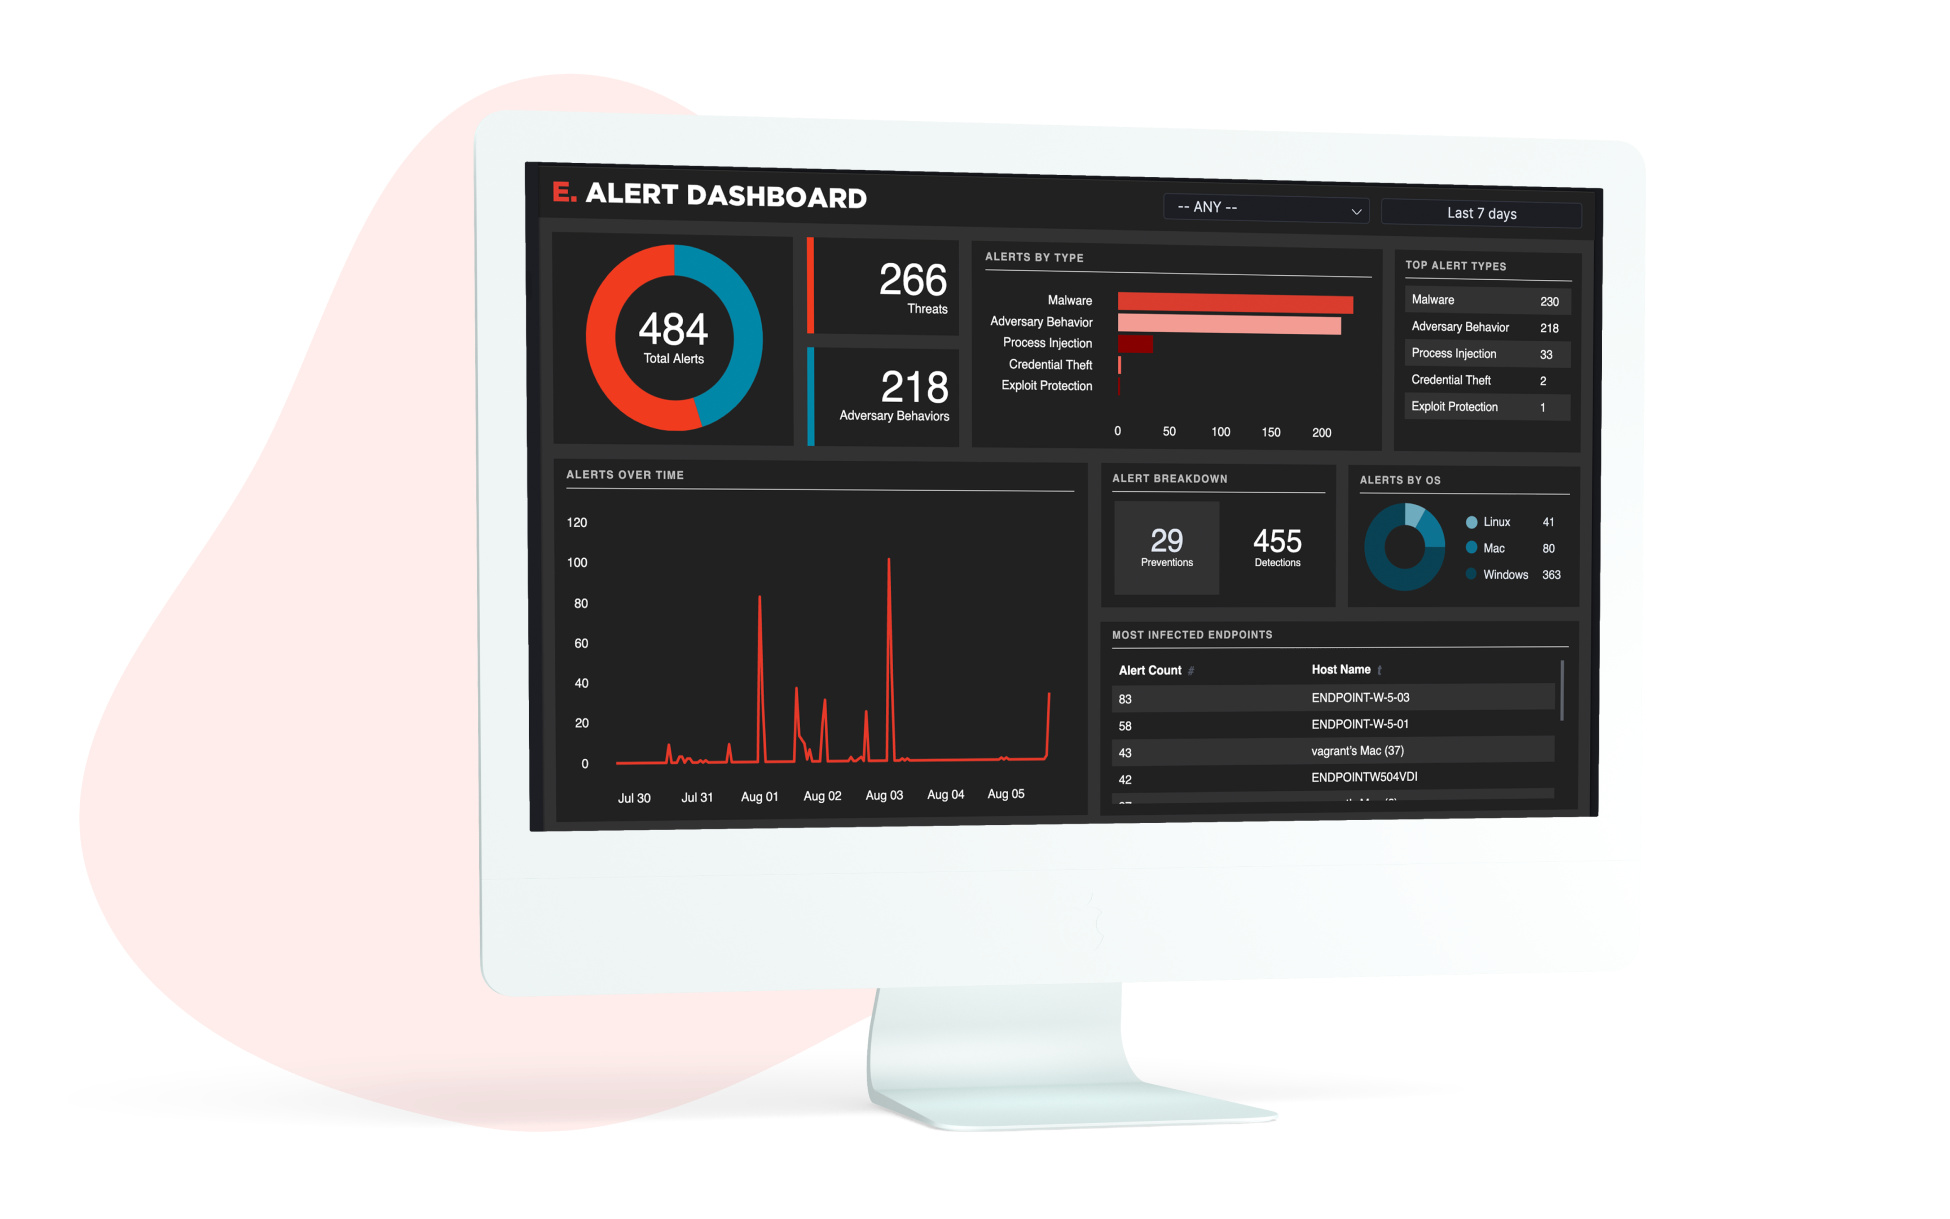
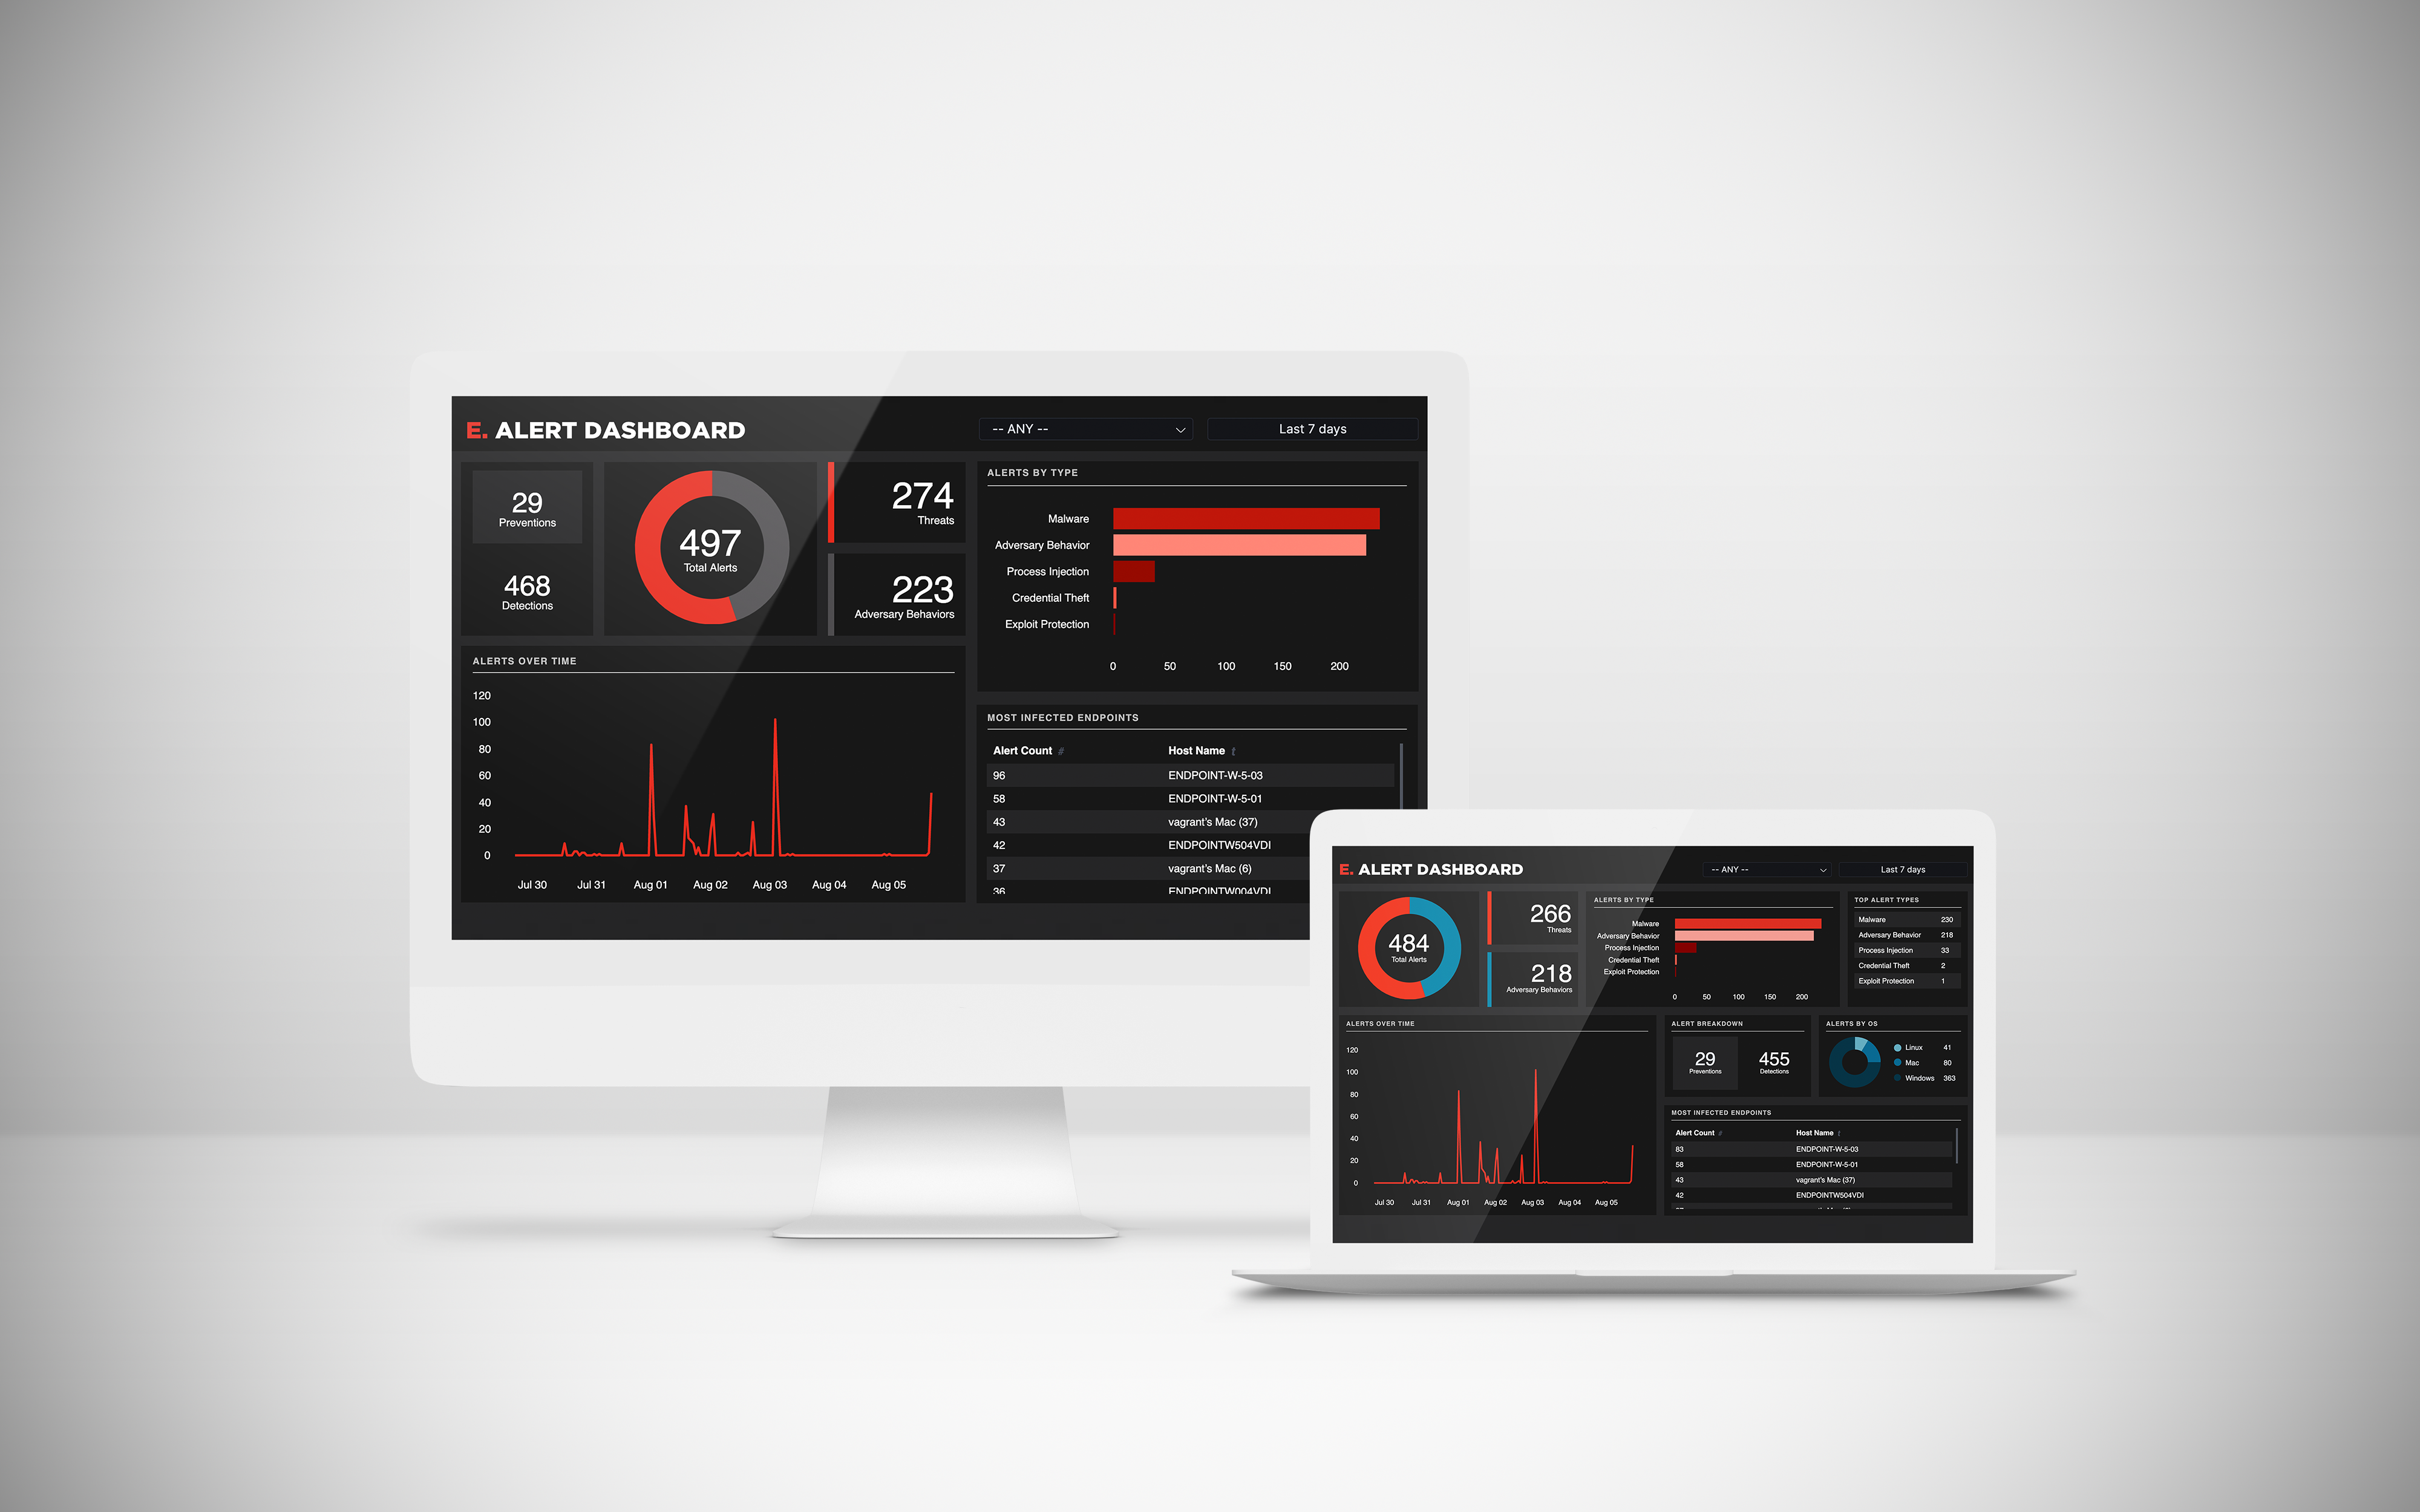
These live-analytic dashboards help security response teams monitor their environments in real time and let them know when malicious activity occurs, using Endpoint data from Endgame and visualization tools from Kibana.
About
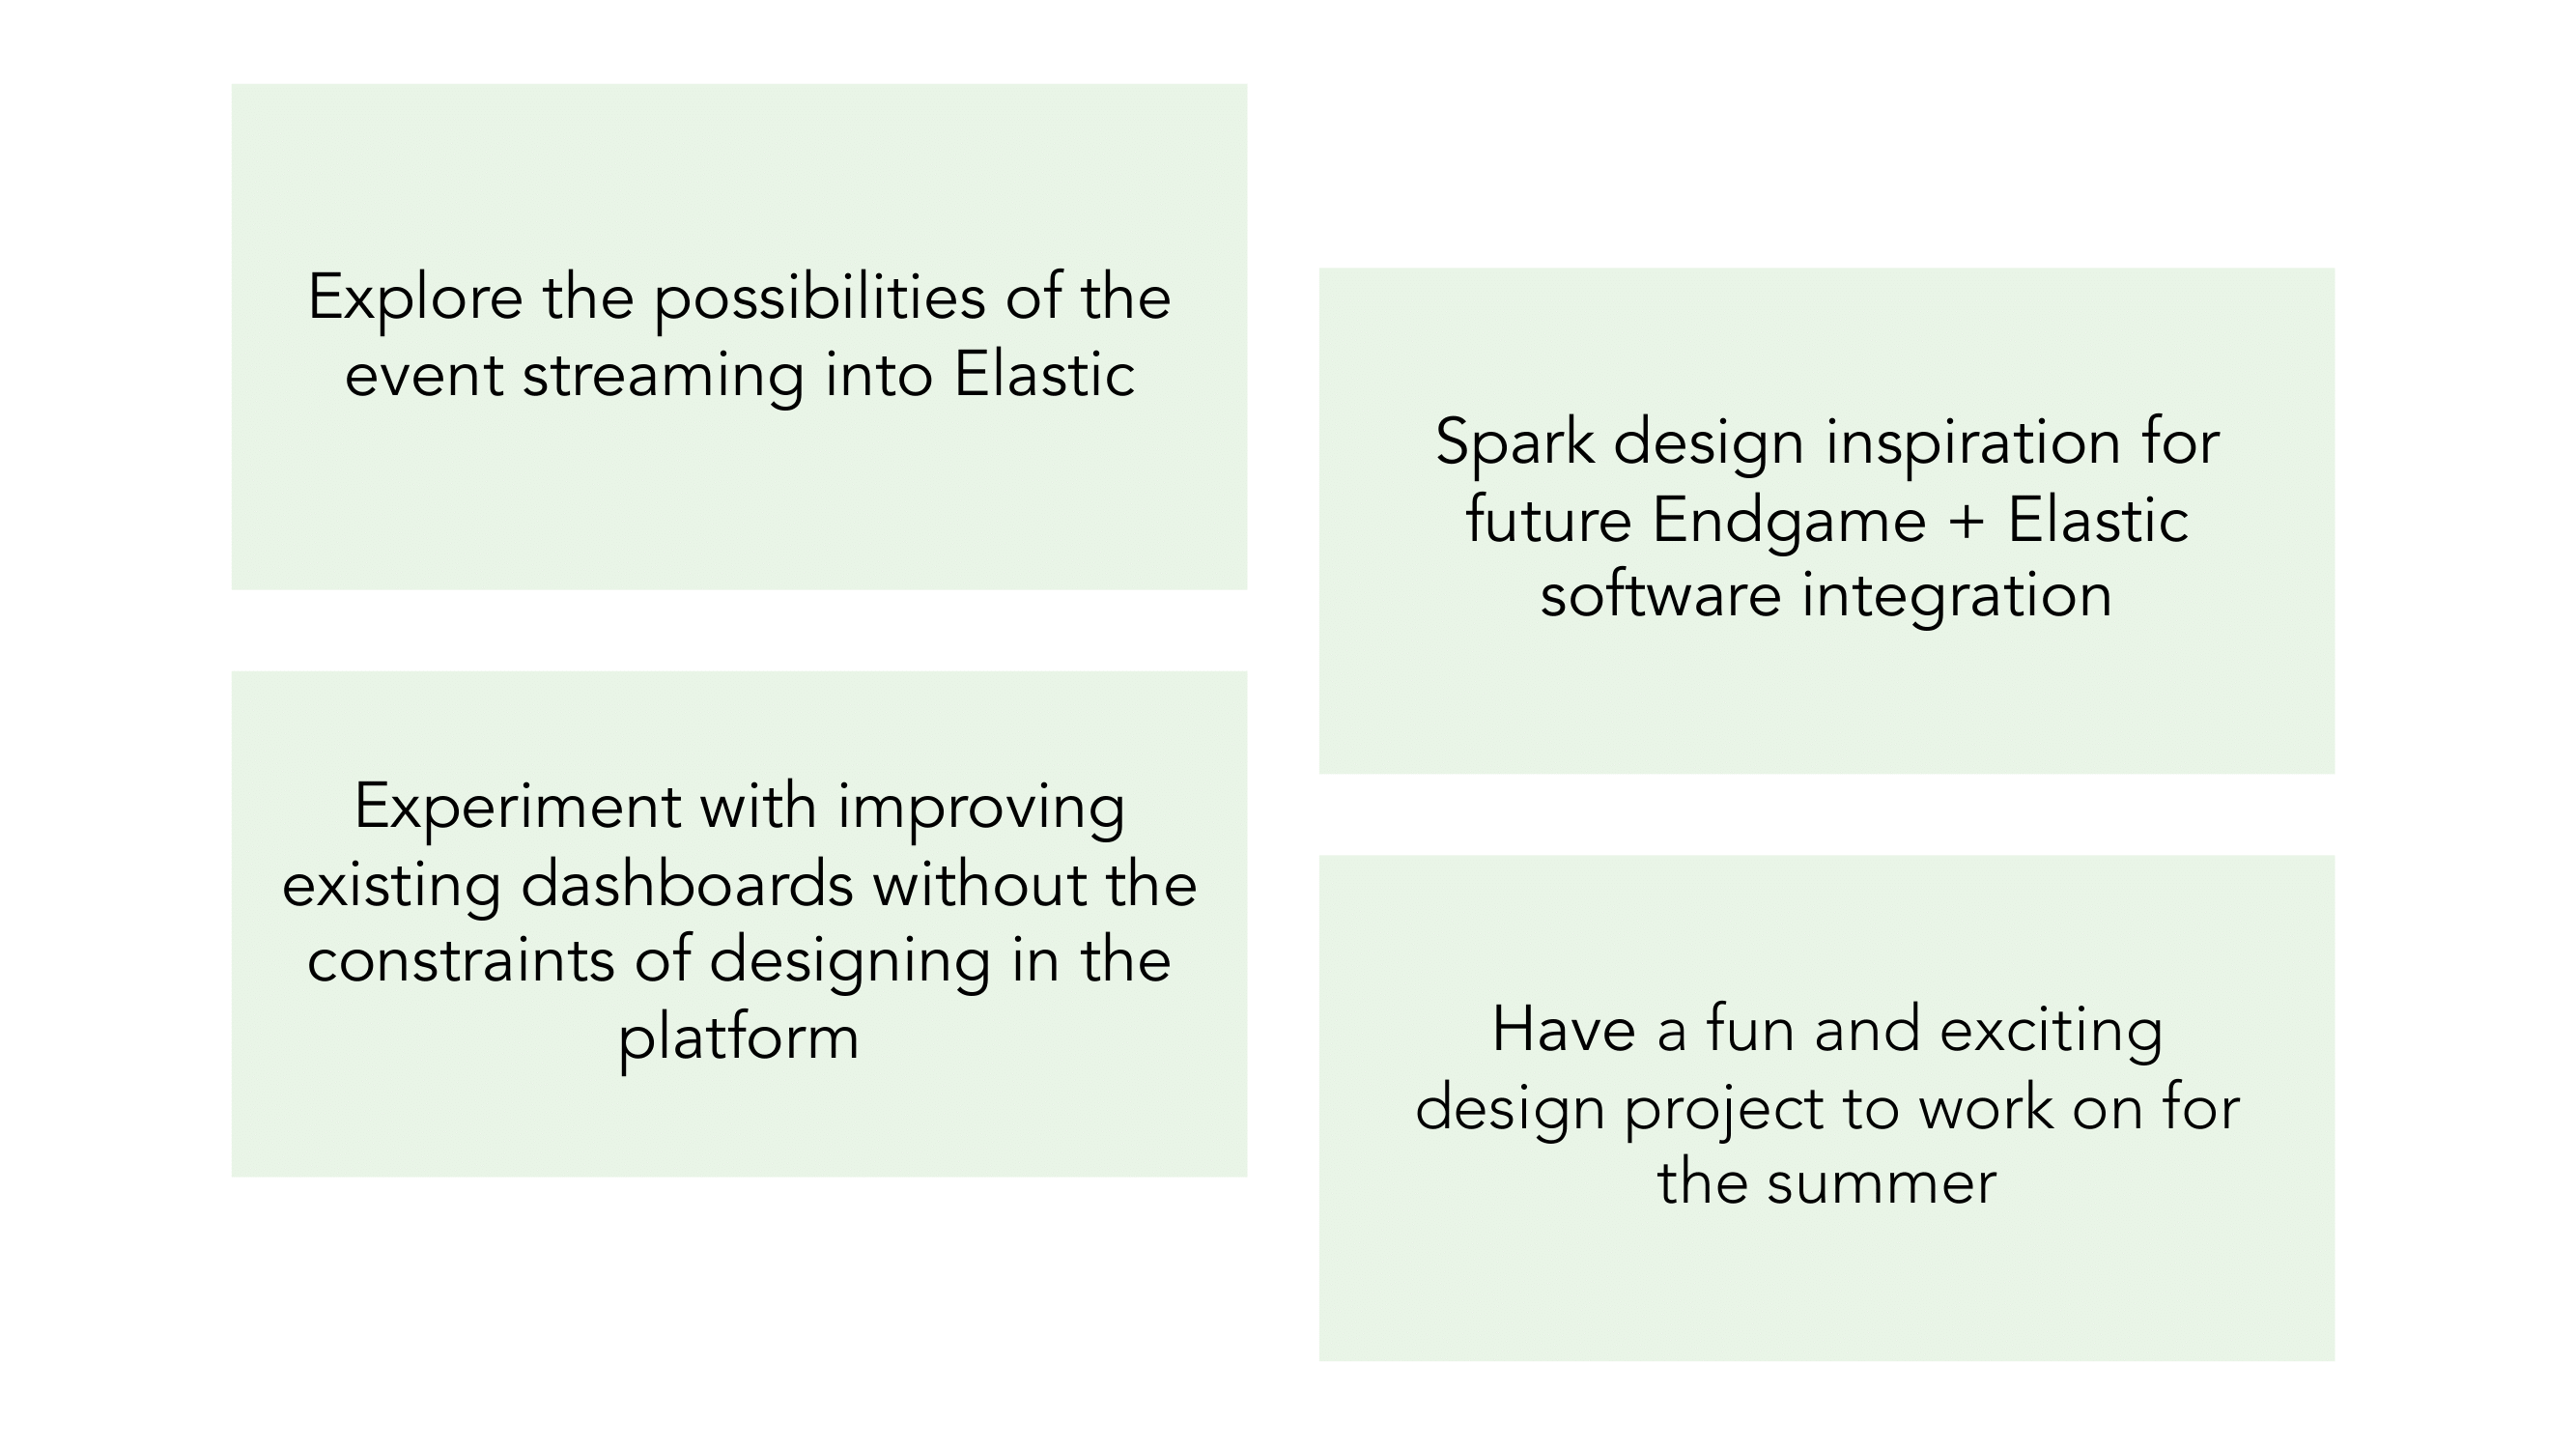
In June, Endgame announced how the company entered an acquisition agreement with Elastic. For my summer intern project, I used an application by Elastic, Canvas, to create live data-analytic dashboards using the data streamed from Endgame to help users monitor and contextualize their security environment.
Role
UX Designer, User Researcher, Developer
Date + Duration
Summer 2019 // 10 weeks
Tools
Adobe Illustrator, Canvas, CSS, Sketch, SQL
Featured
Prodct Demo at Black Hat 2019
Blog post on Endgame Blog
Overview
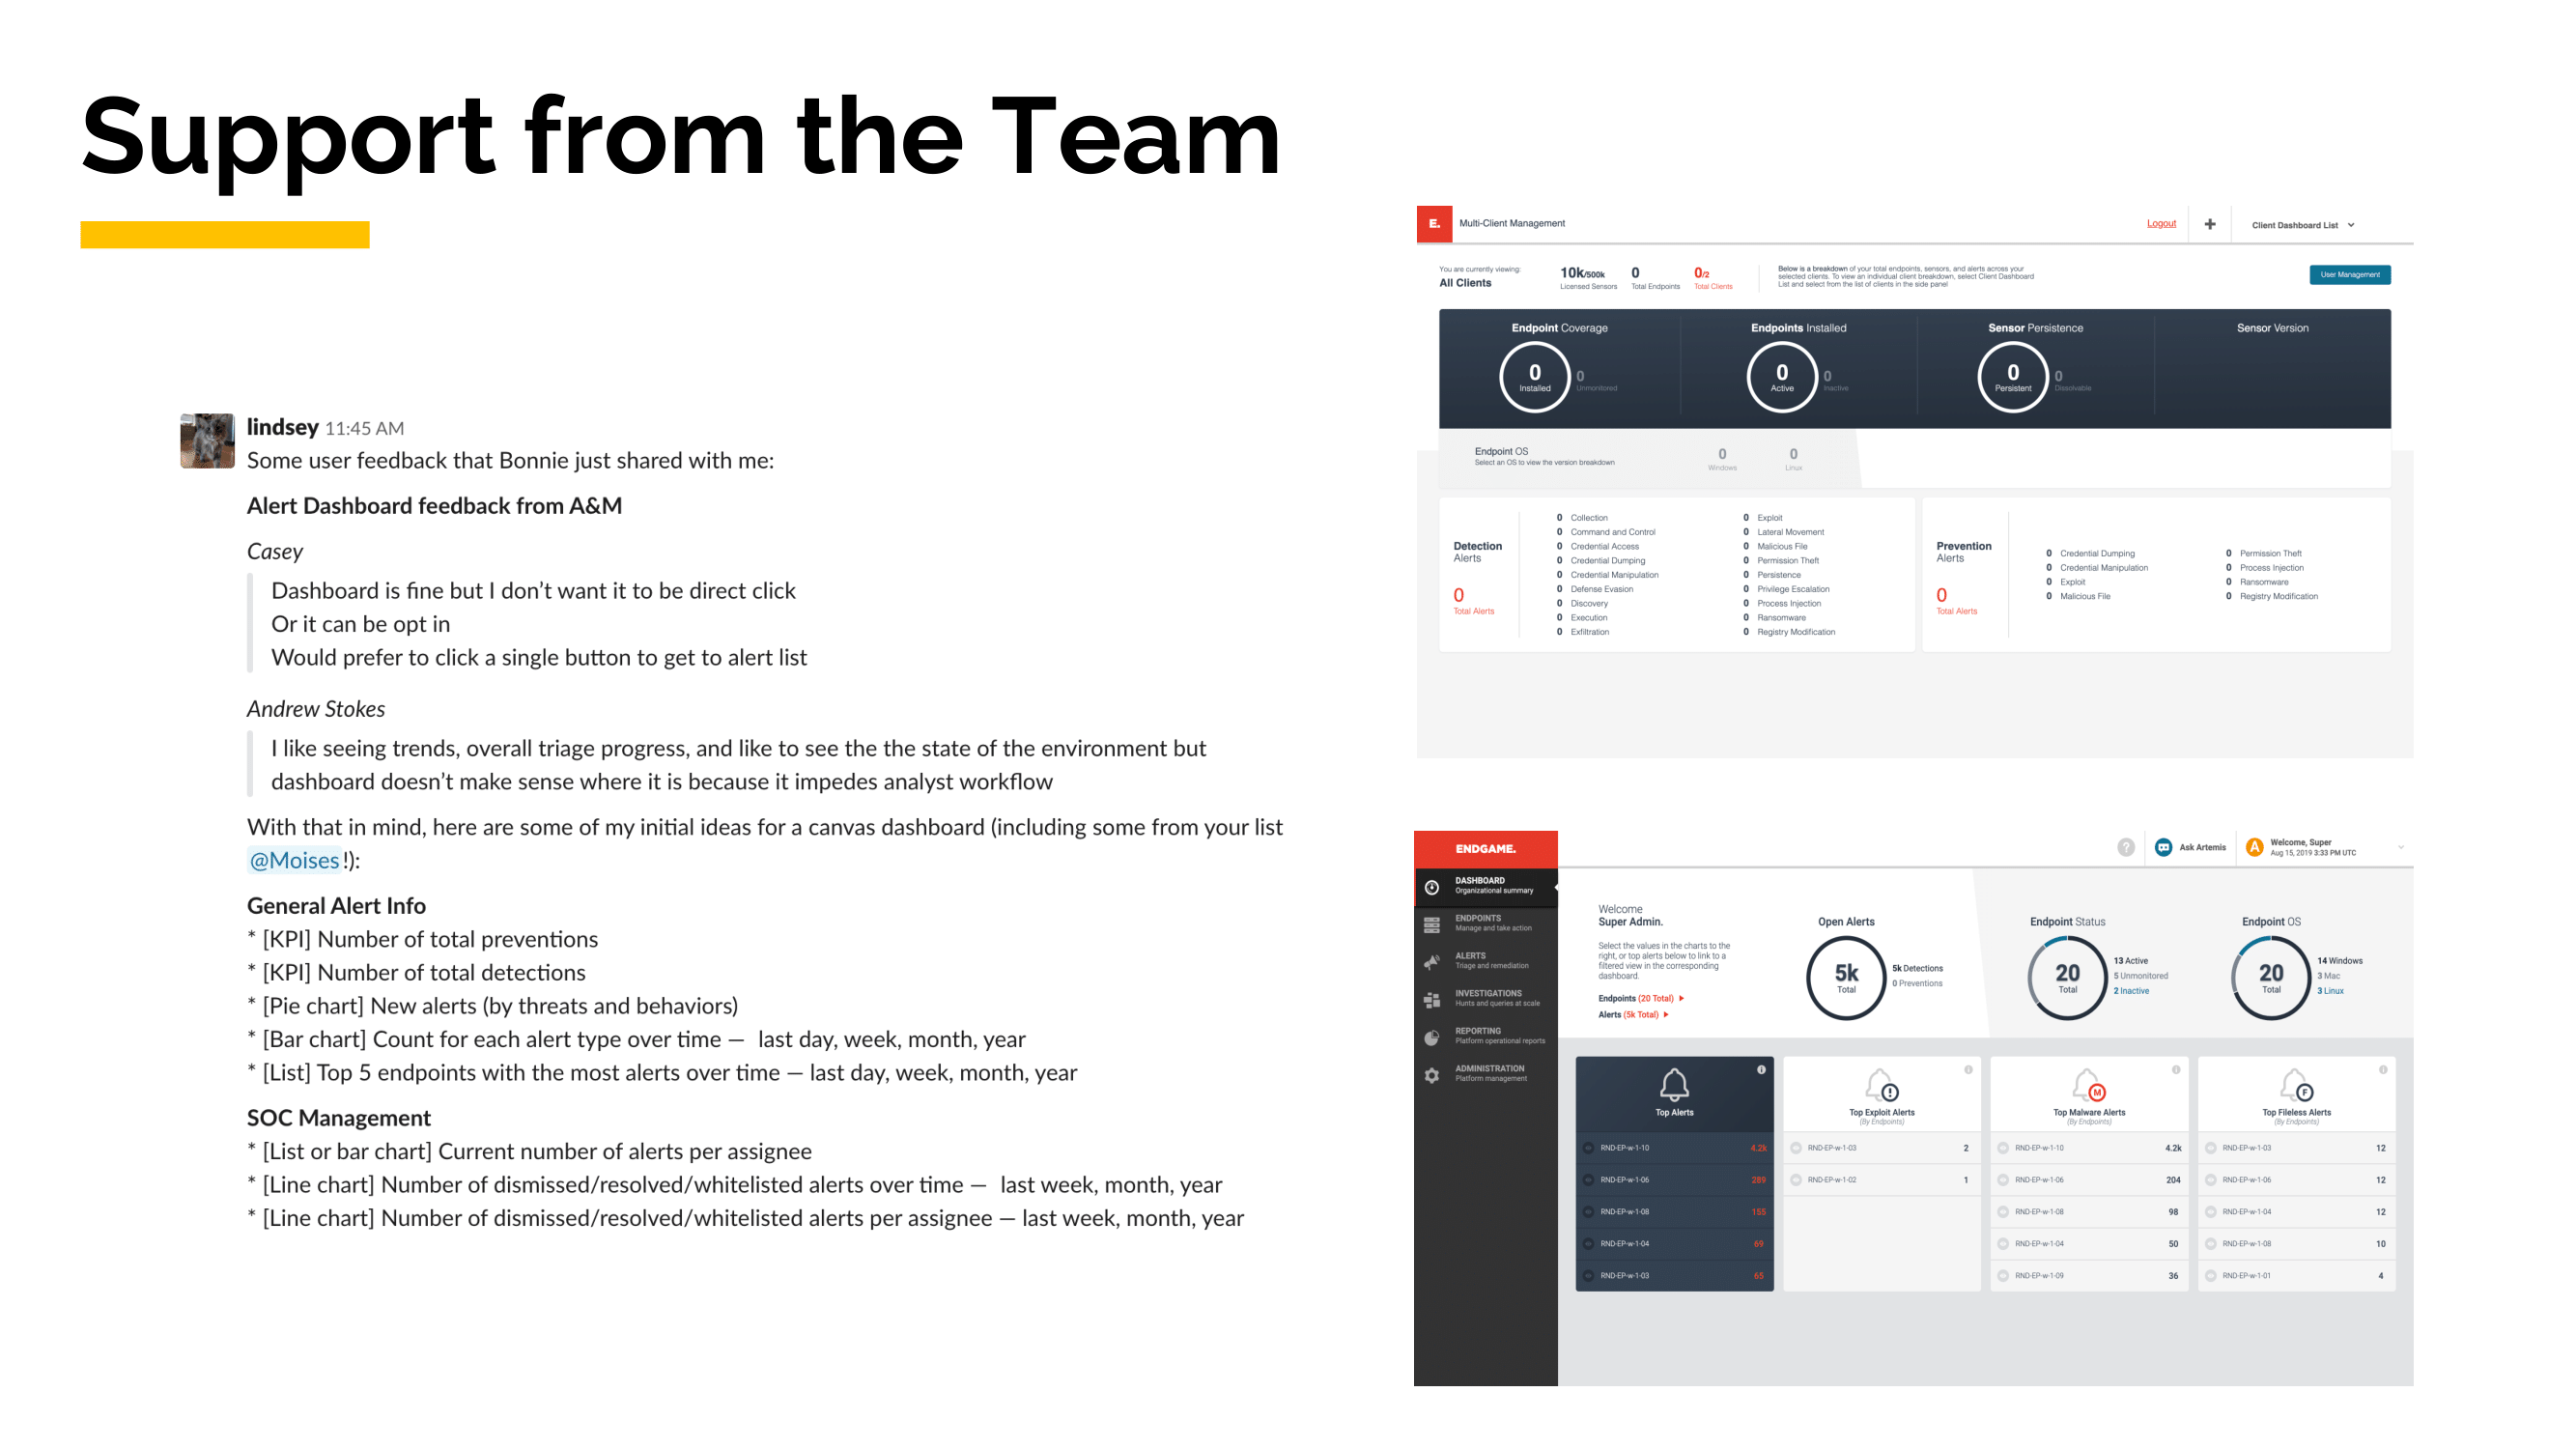
Context is everything in security. In order to build an effective security strategy, they need an information security team that is on top of their game and is up-to-date on the state of their organization. That's why dashboards and other visualizations are instrumental tools for them. They help teams contextualize the state of their organization and allow them to act quickly when bad actors are identified. The design of these visualization tools can make or break the effectiveness of an info-sec team.
For this project, we focused on creating dashboards for one specific persona: the security operations center manager. The SOC manager is responsible for overseeing the other members of the security response team and leading them in monitoring and protecting the organization's assets. Having a live-data dashboard that helps them monitor the health of their environment would be a helpful tool in their arsenal for defending their organization's infrastructure.
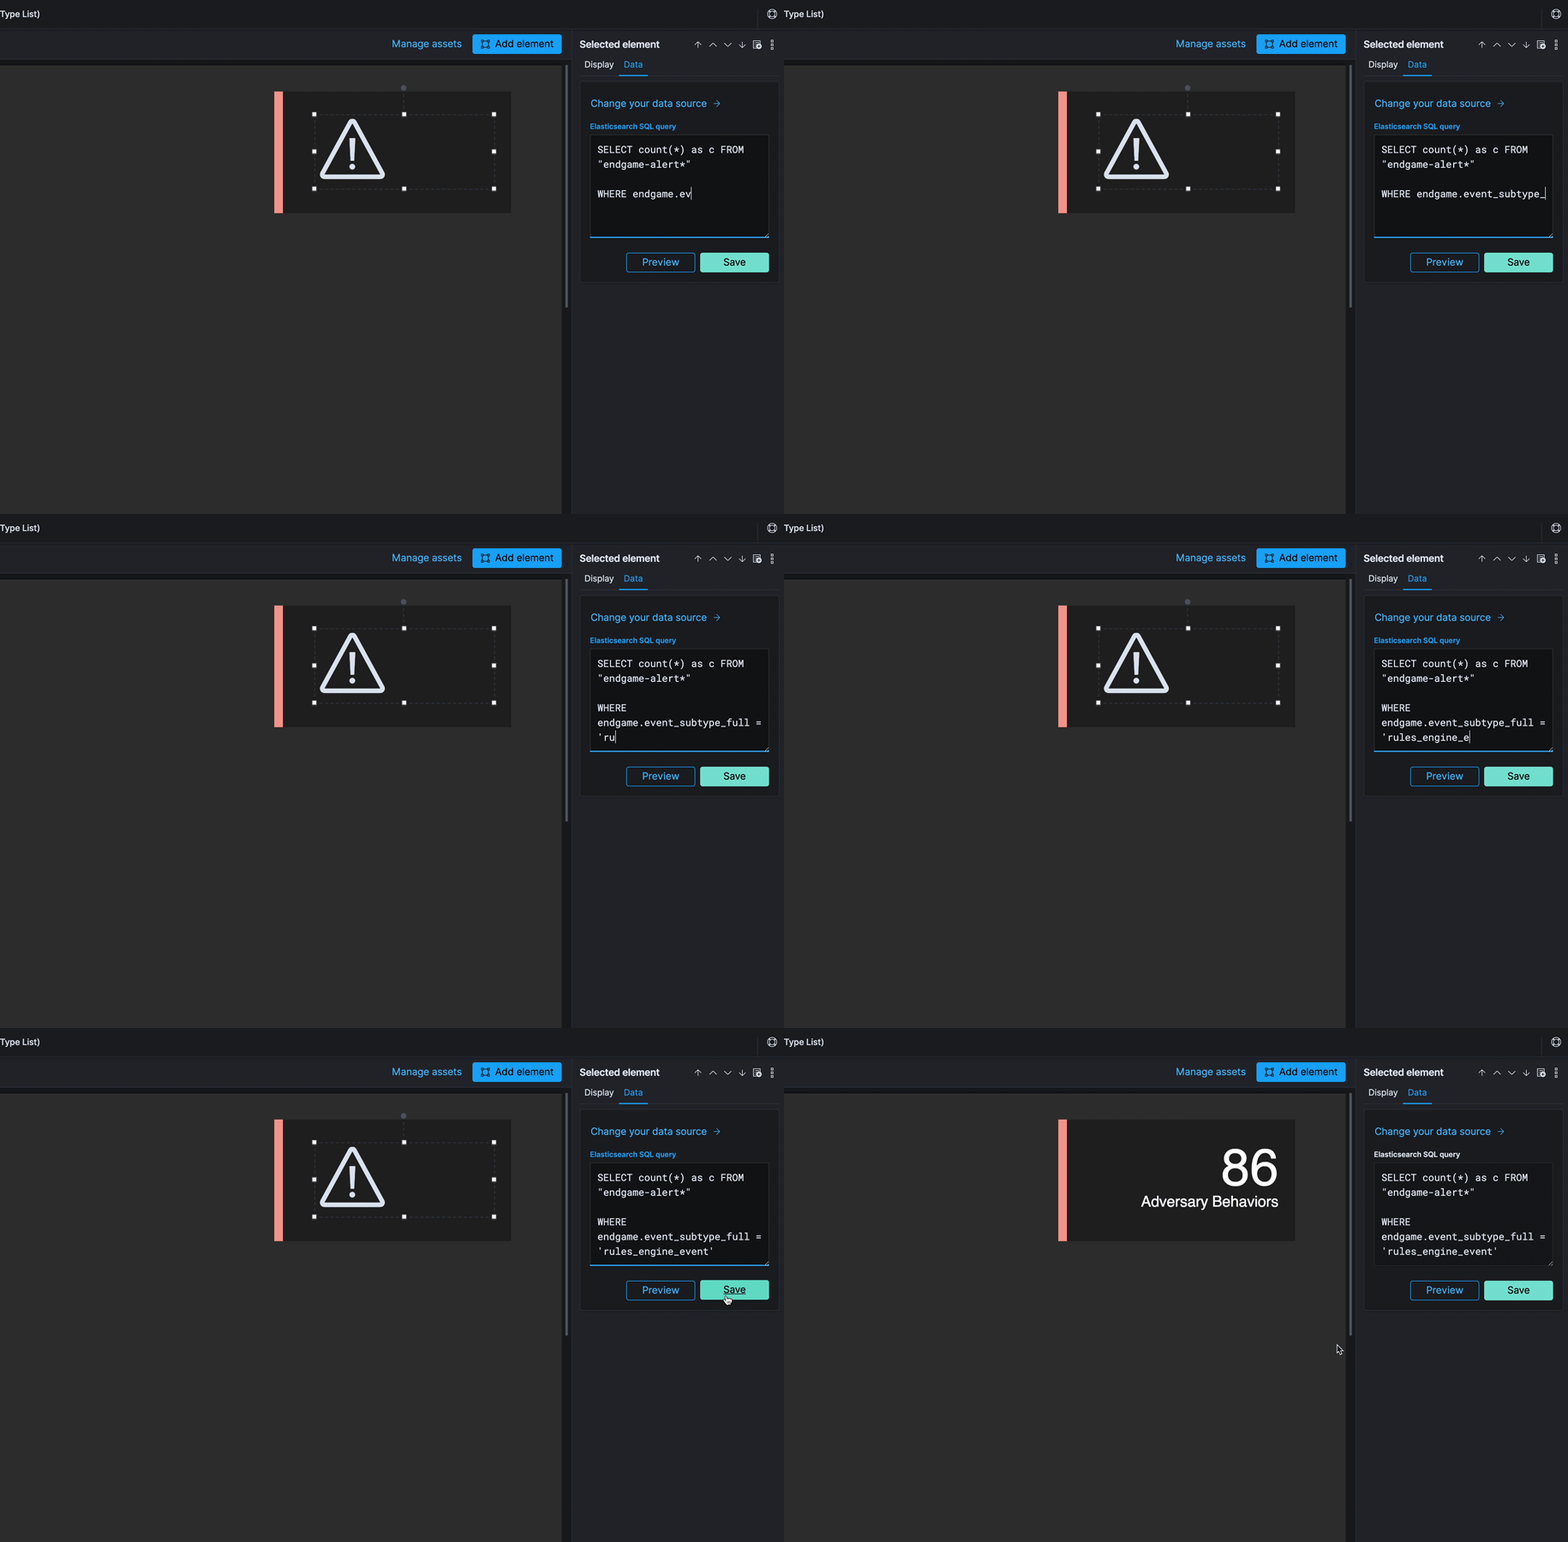
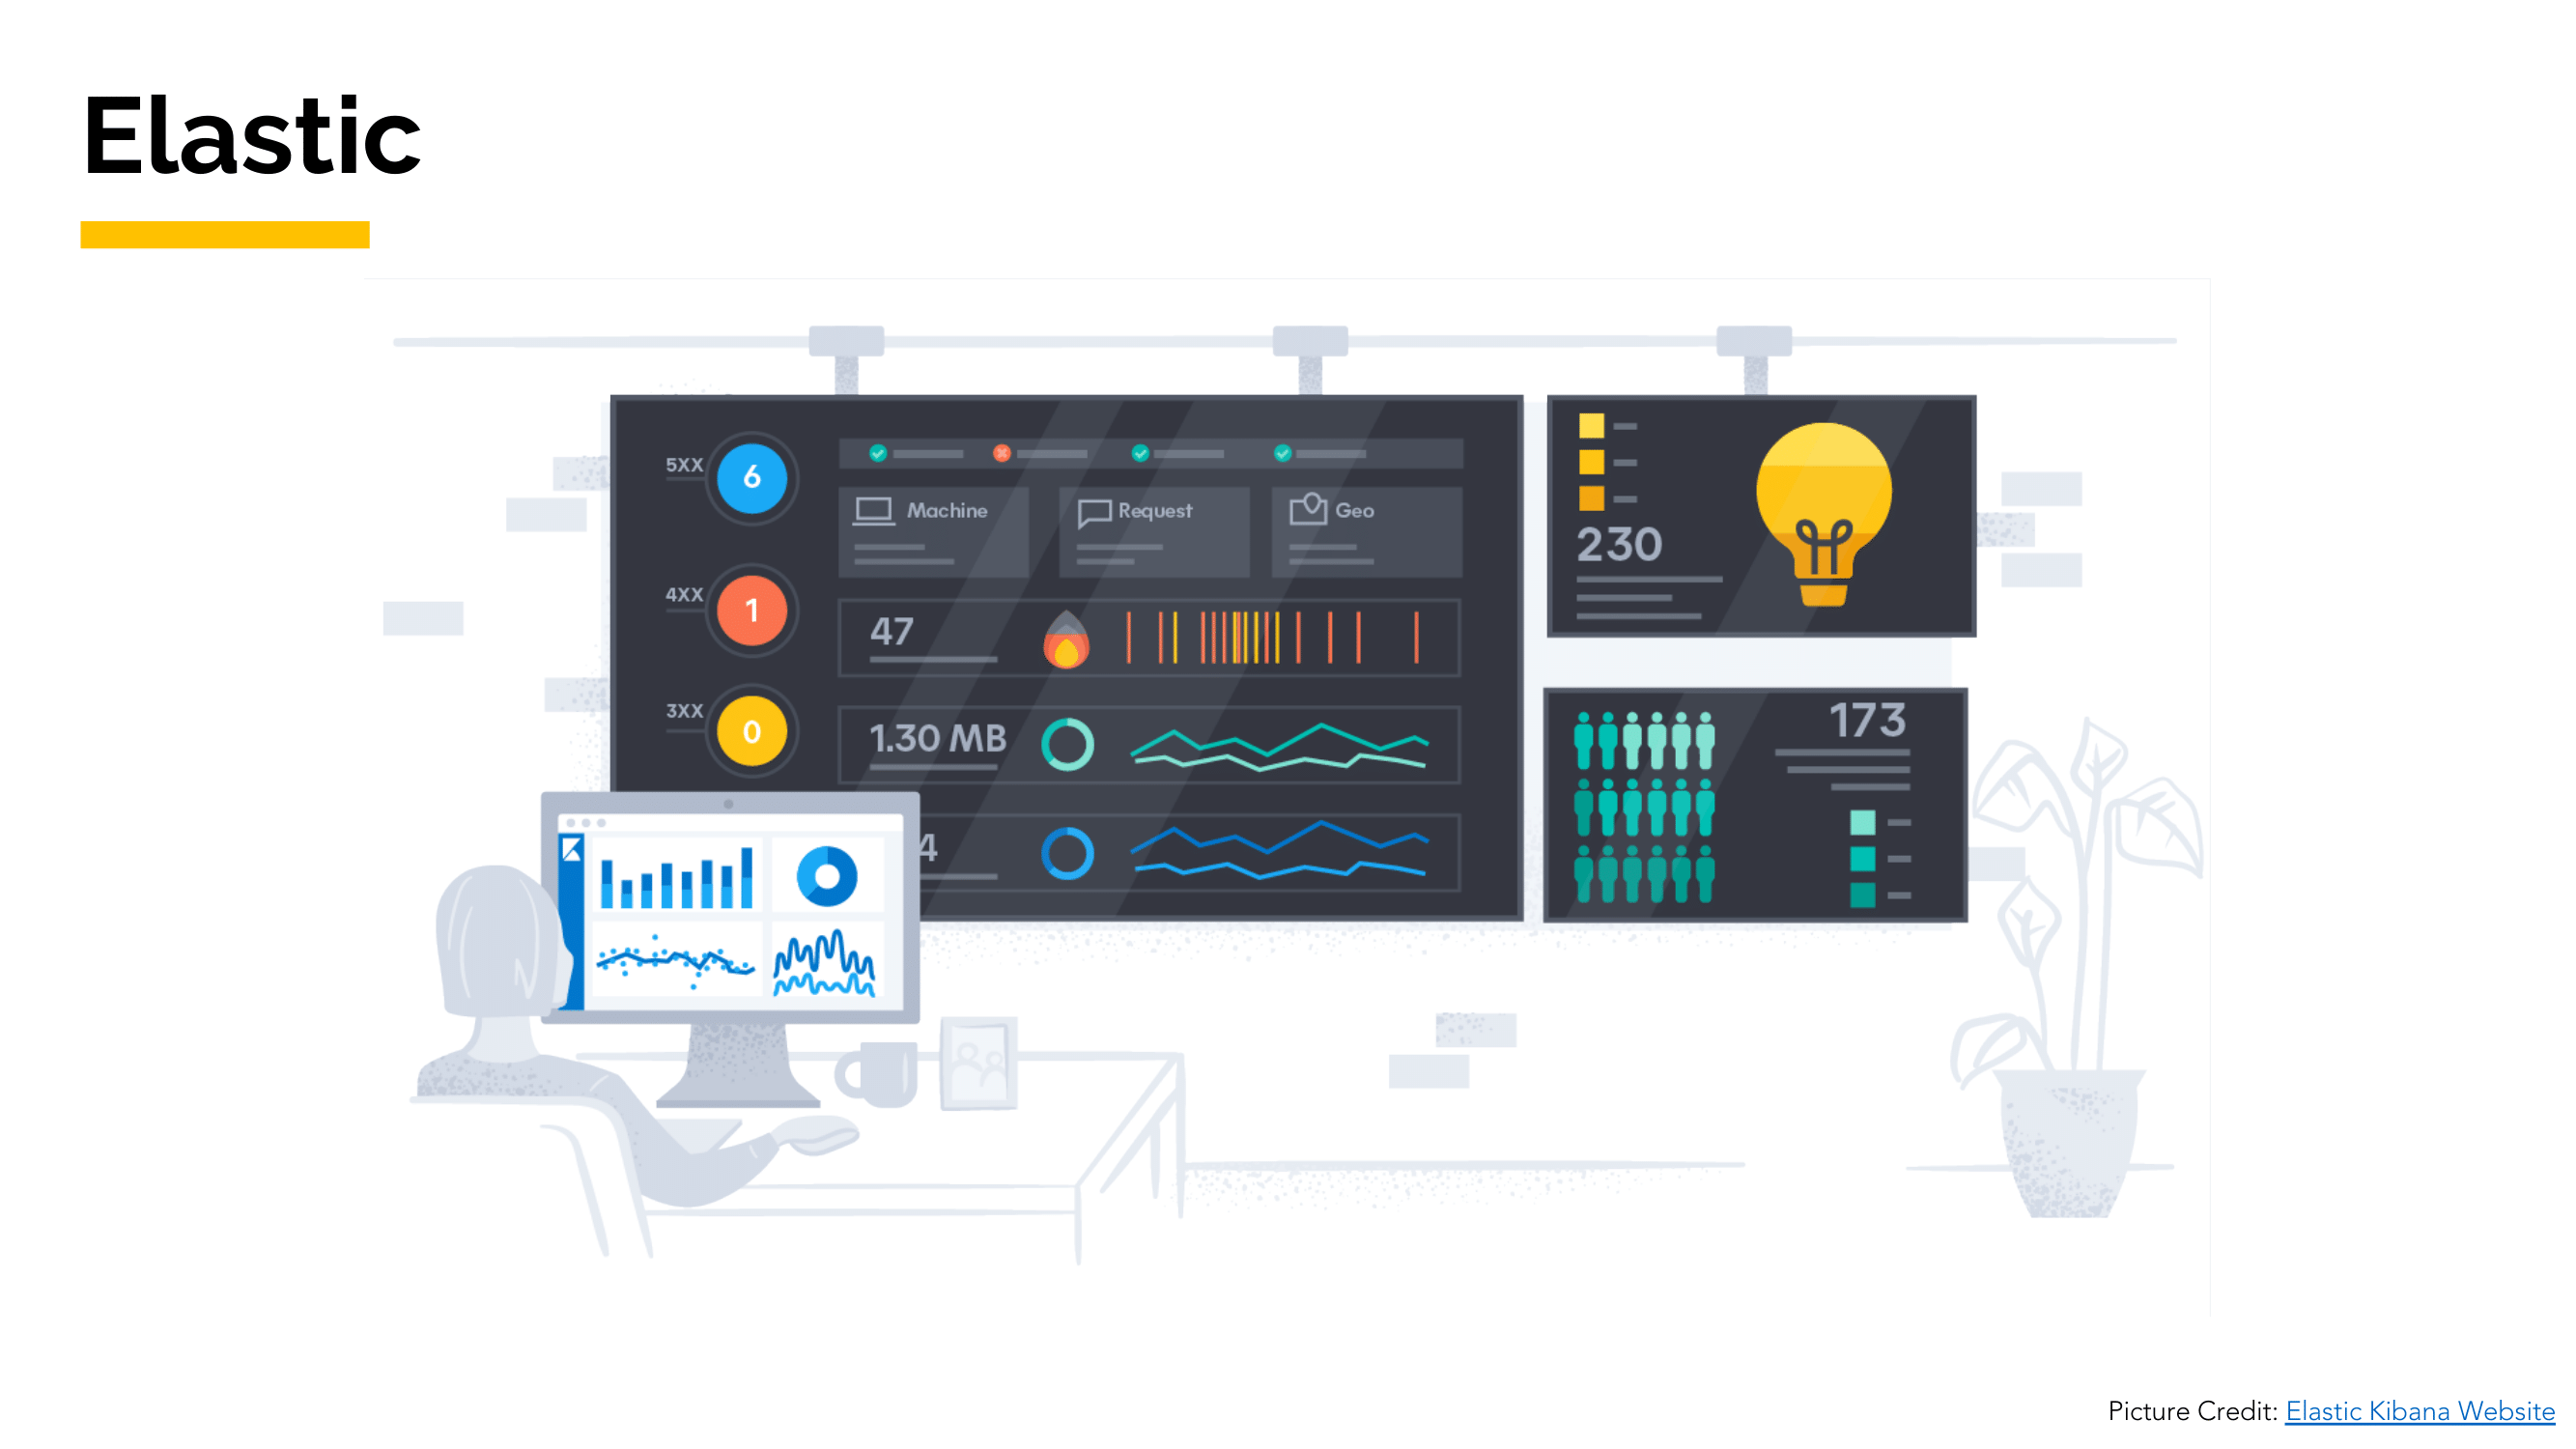
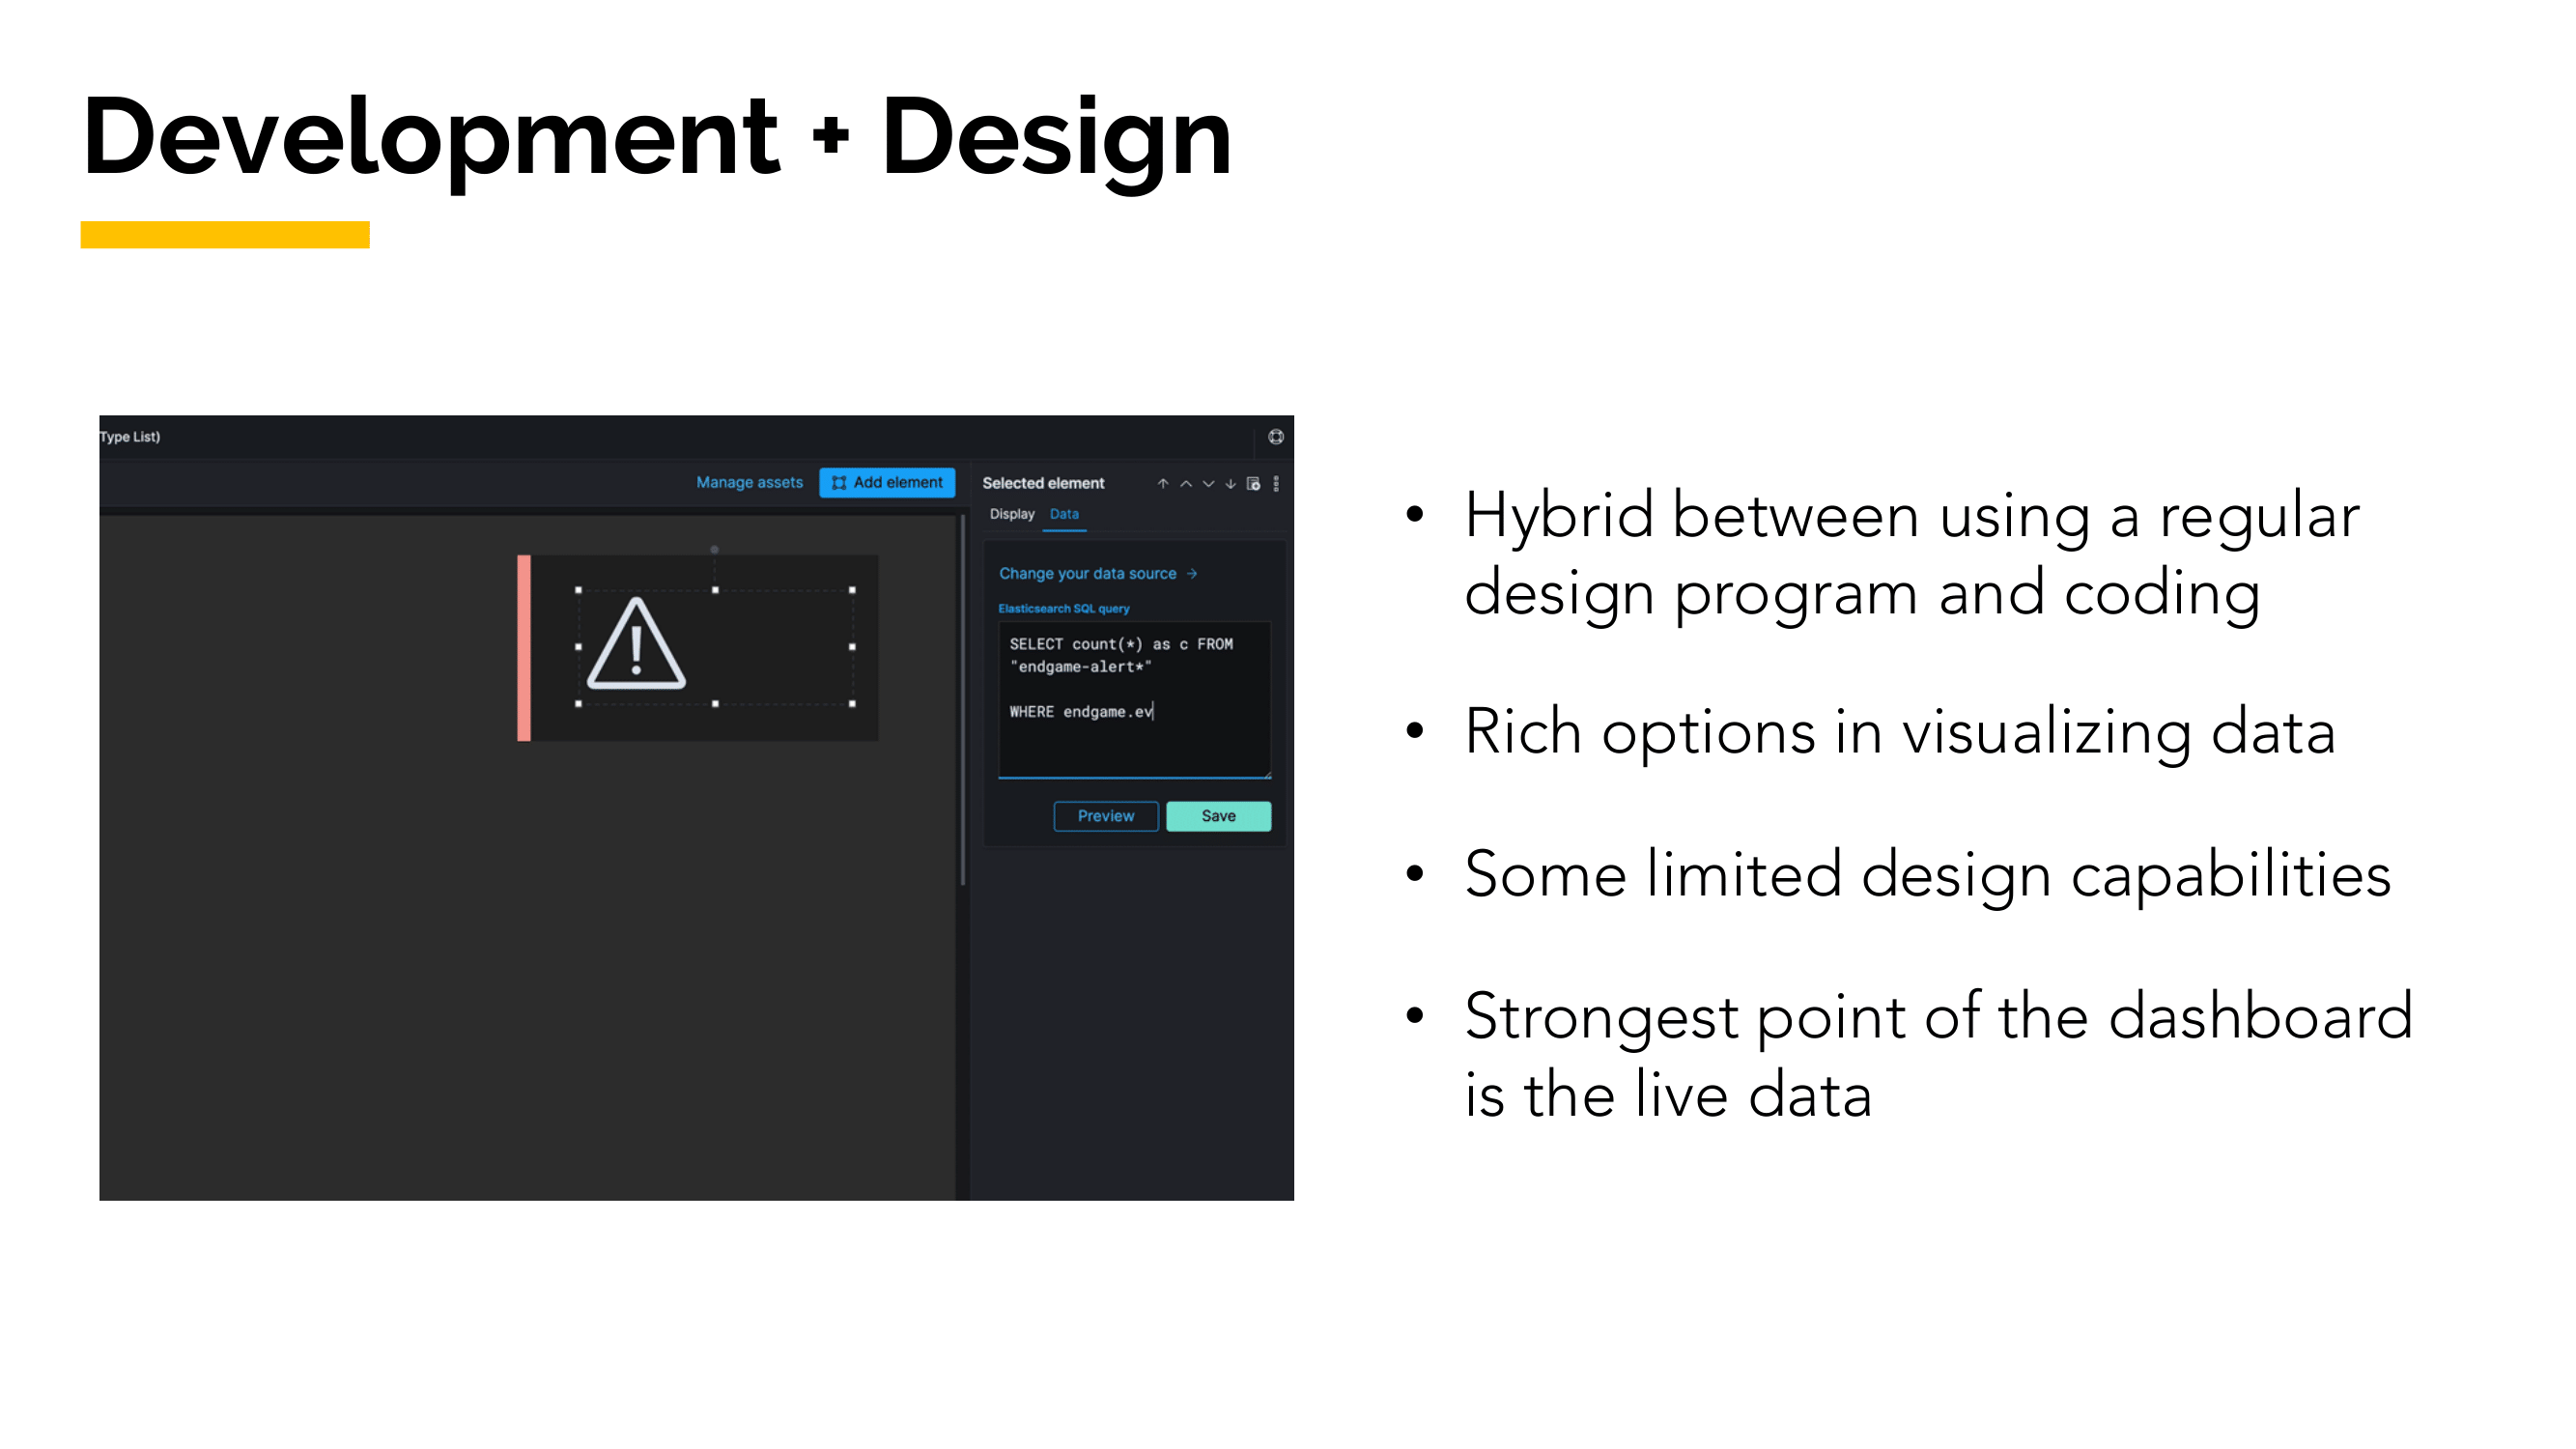
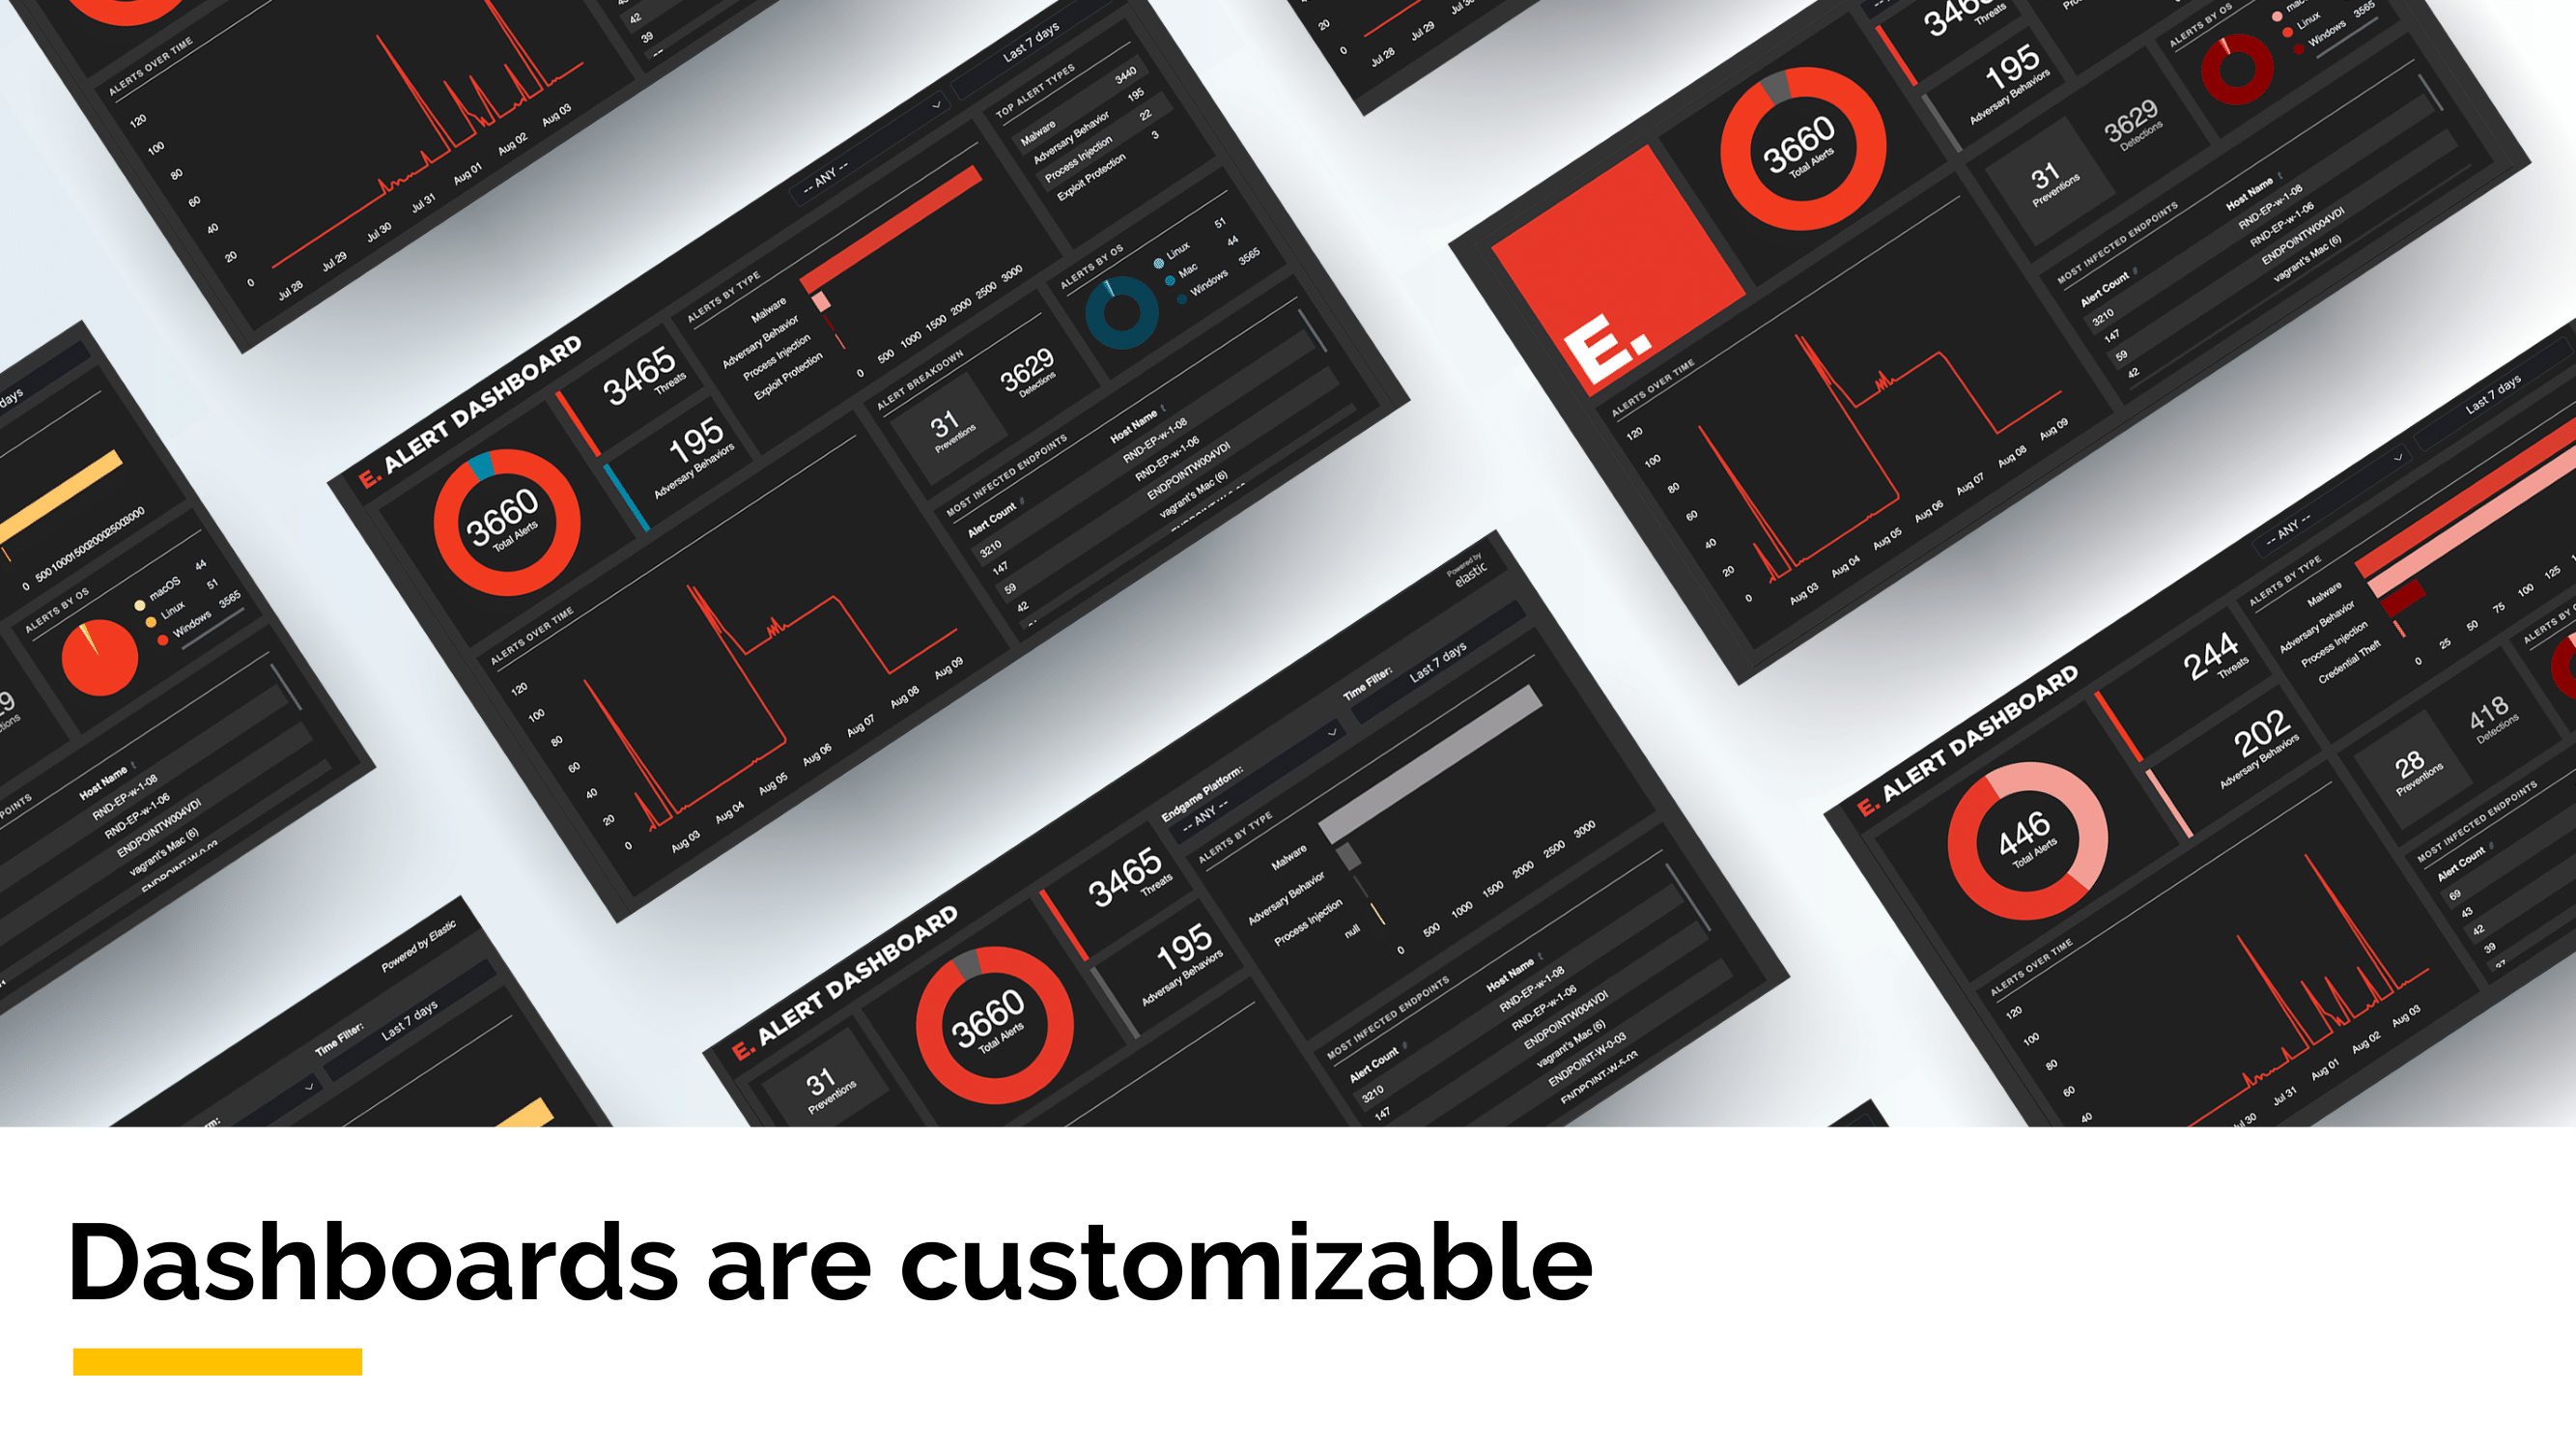
Canvas is an application that allows users to create highly customizable dashboards using live data streamed from a user’s Elastic Stack. It combines an in-program editor with an expression editor to create truly unique visualizations.
As part of the project, not only did I do the research and design, but I also implemented the dashboard into a working prototype. I wrote queries in SQL to call upon the data streamed from Endgame to create metrics to display in the dashboards. Using the in-application options and CSS, I created the dashboard layout and incorporated elements of visual design.
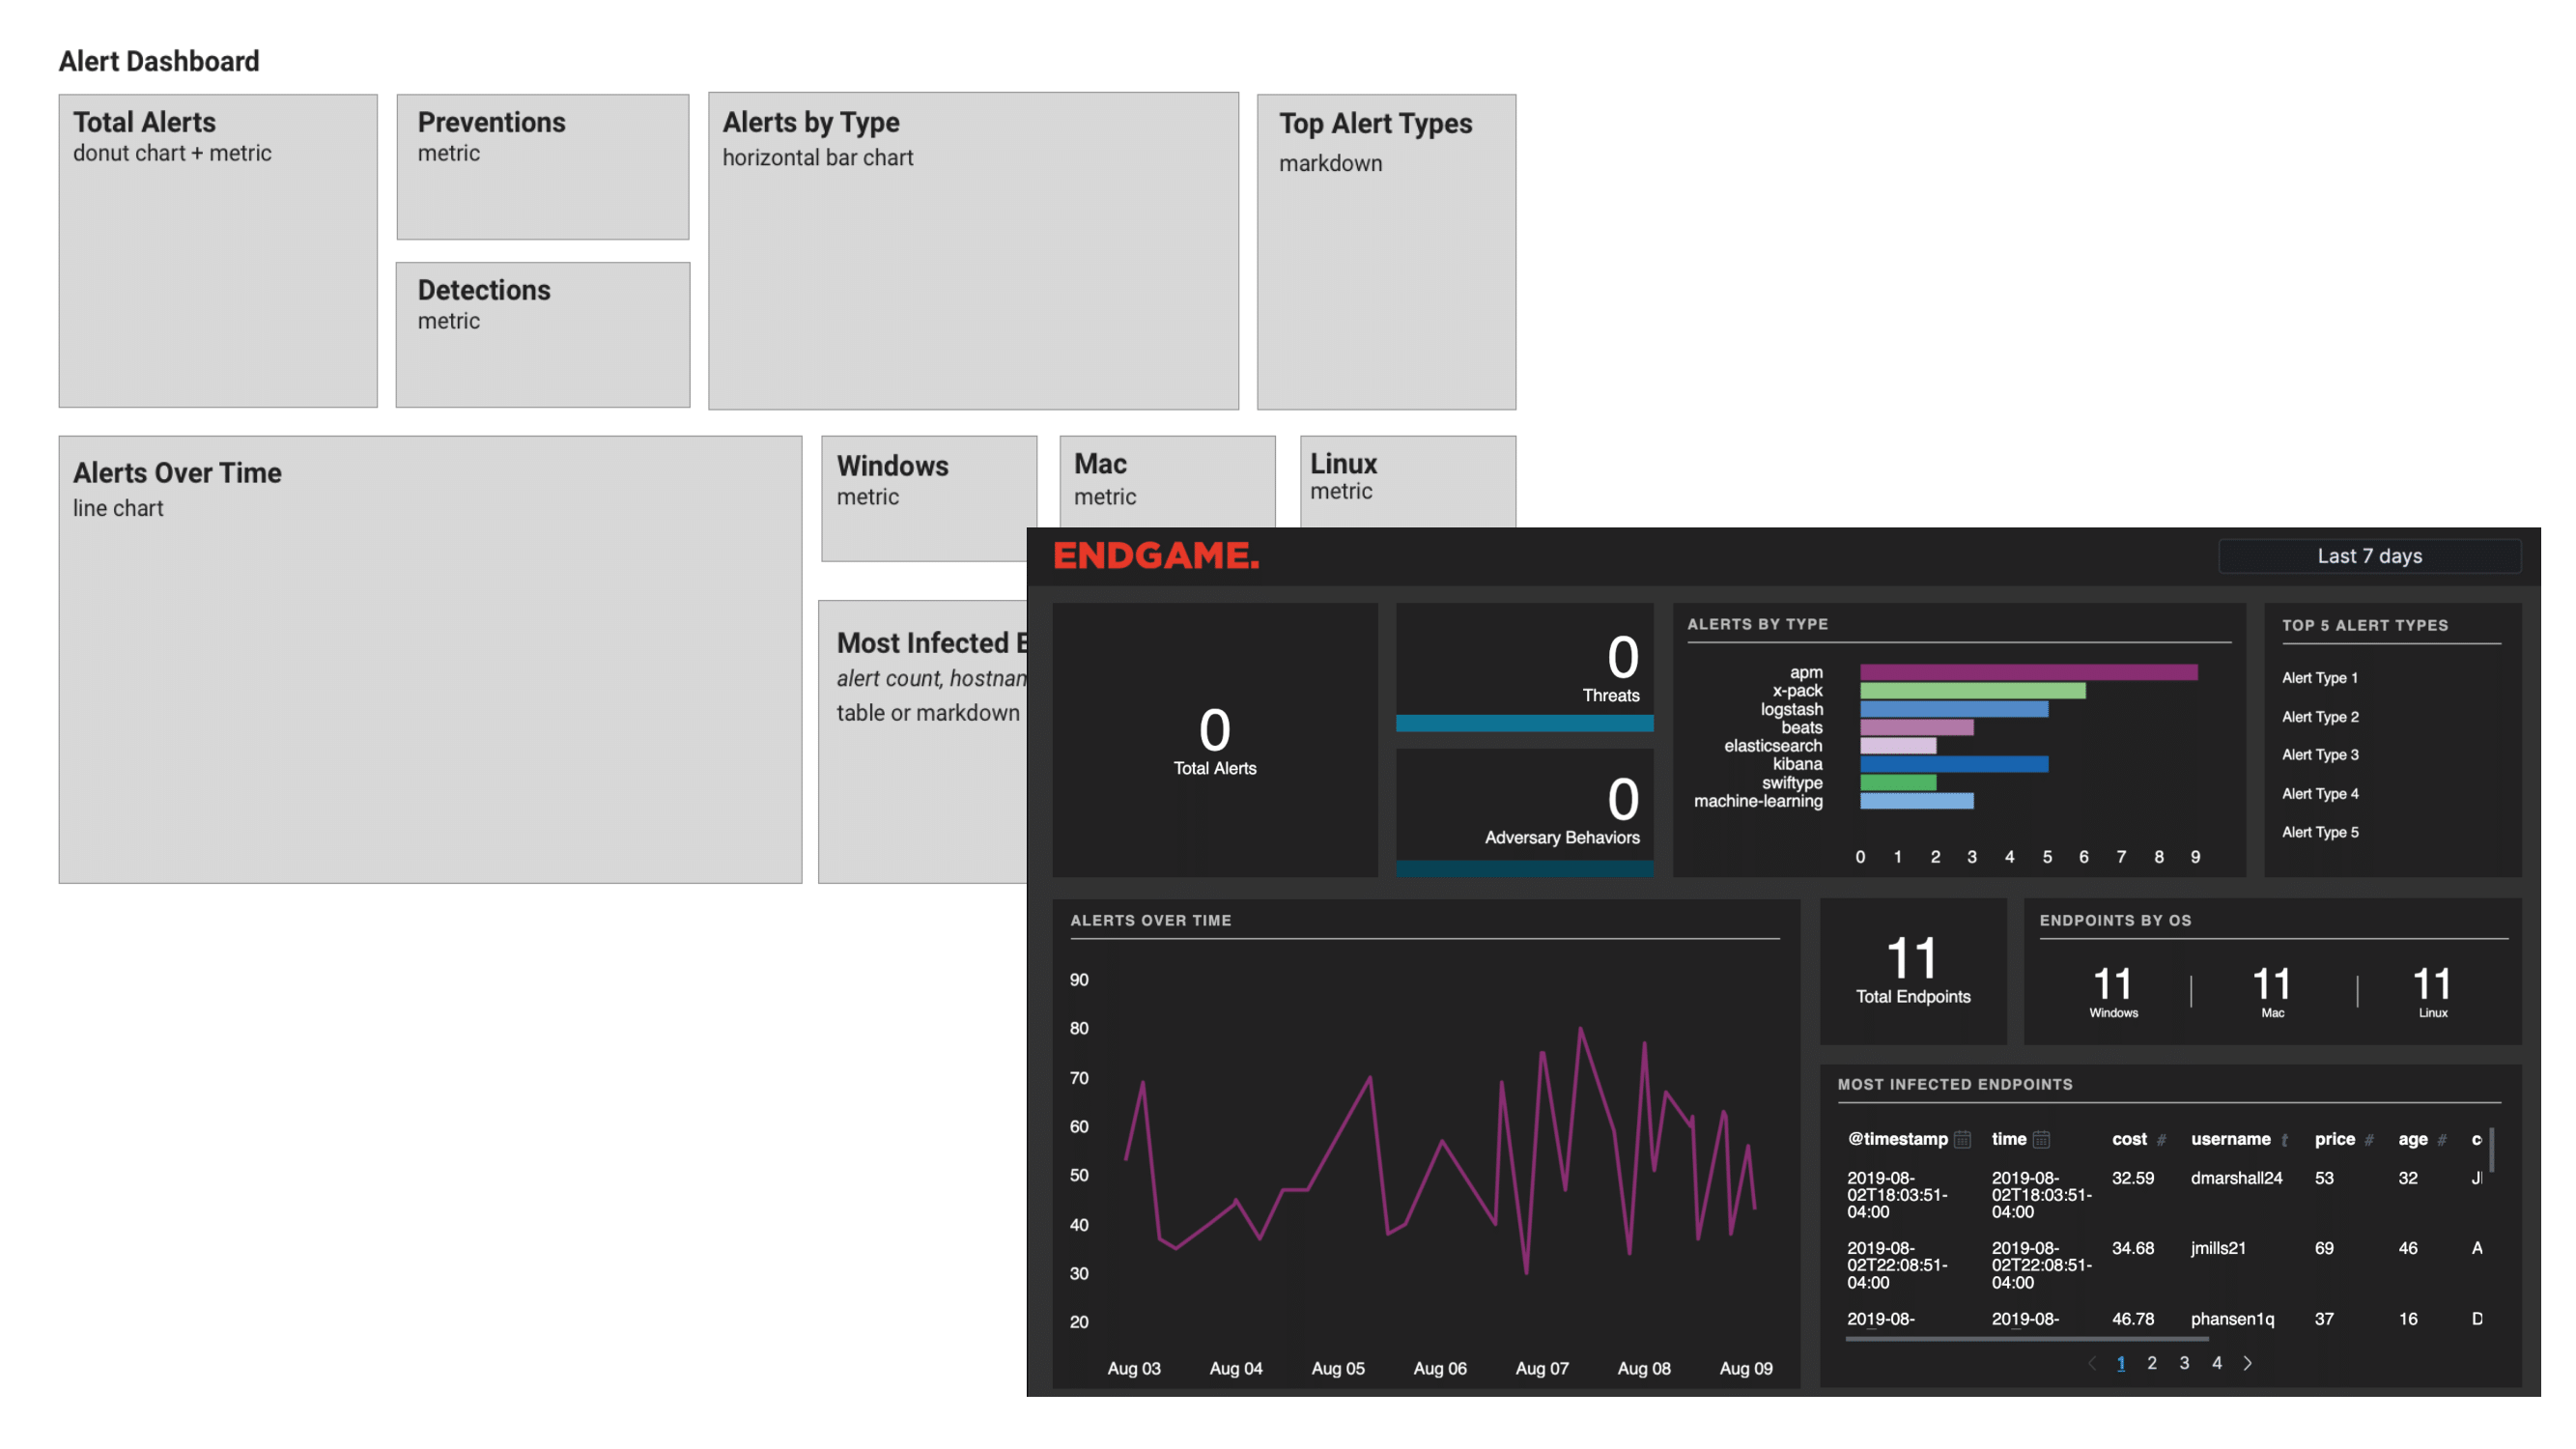
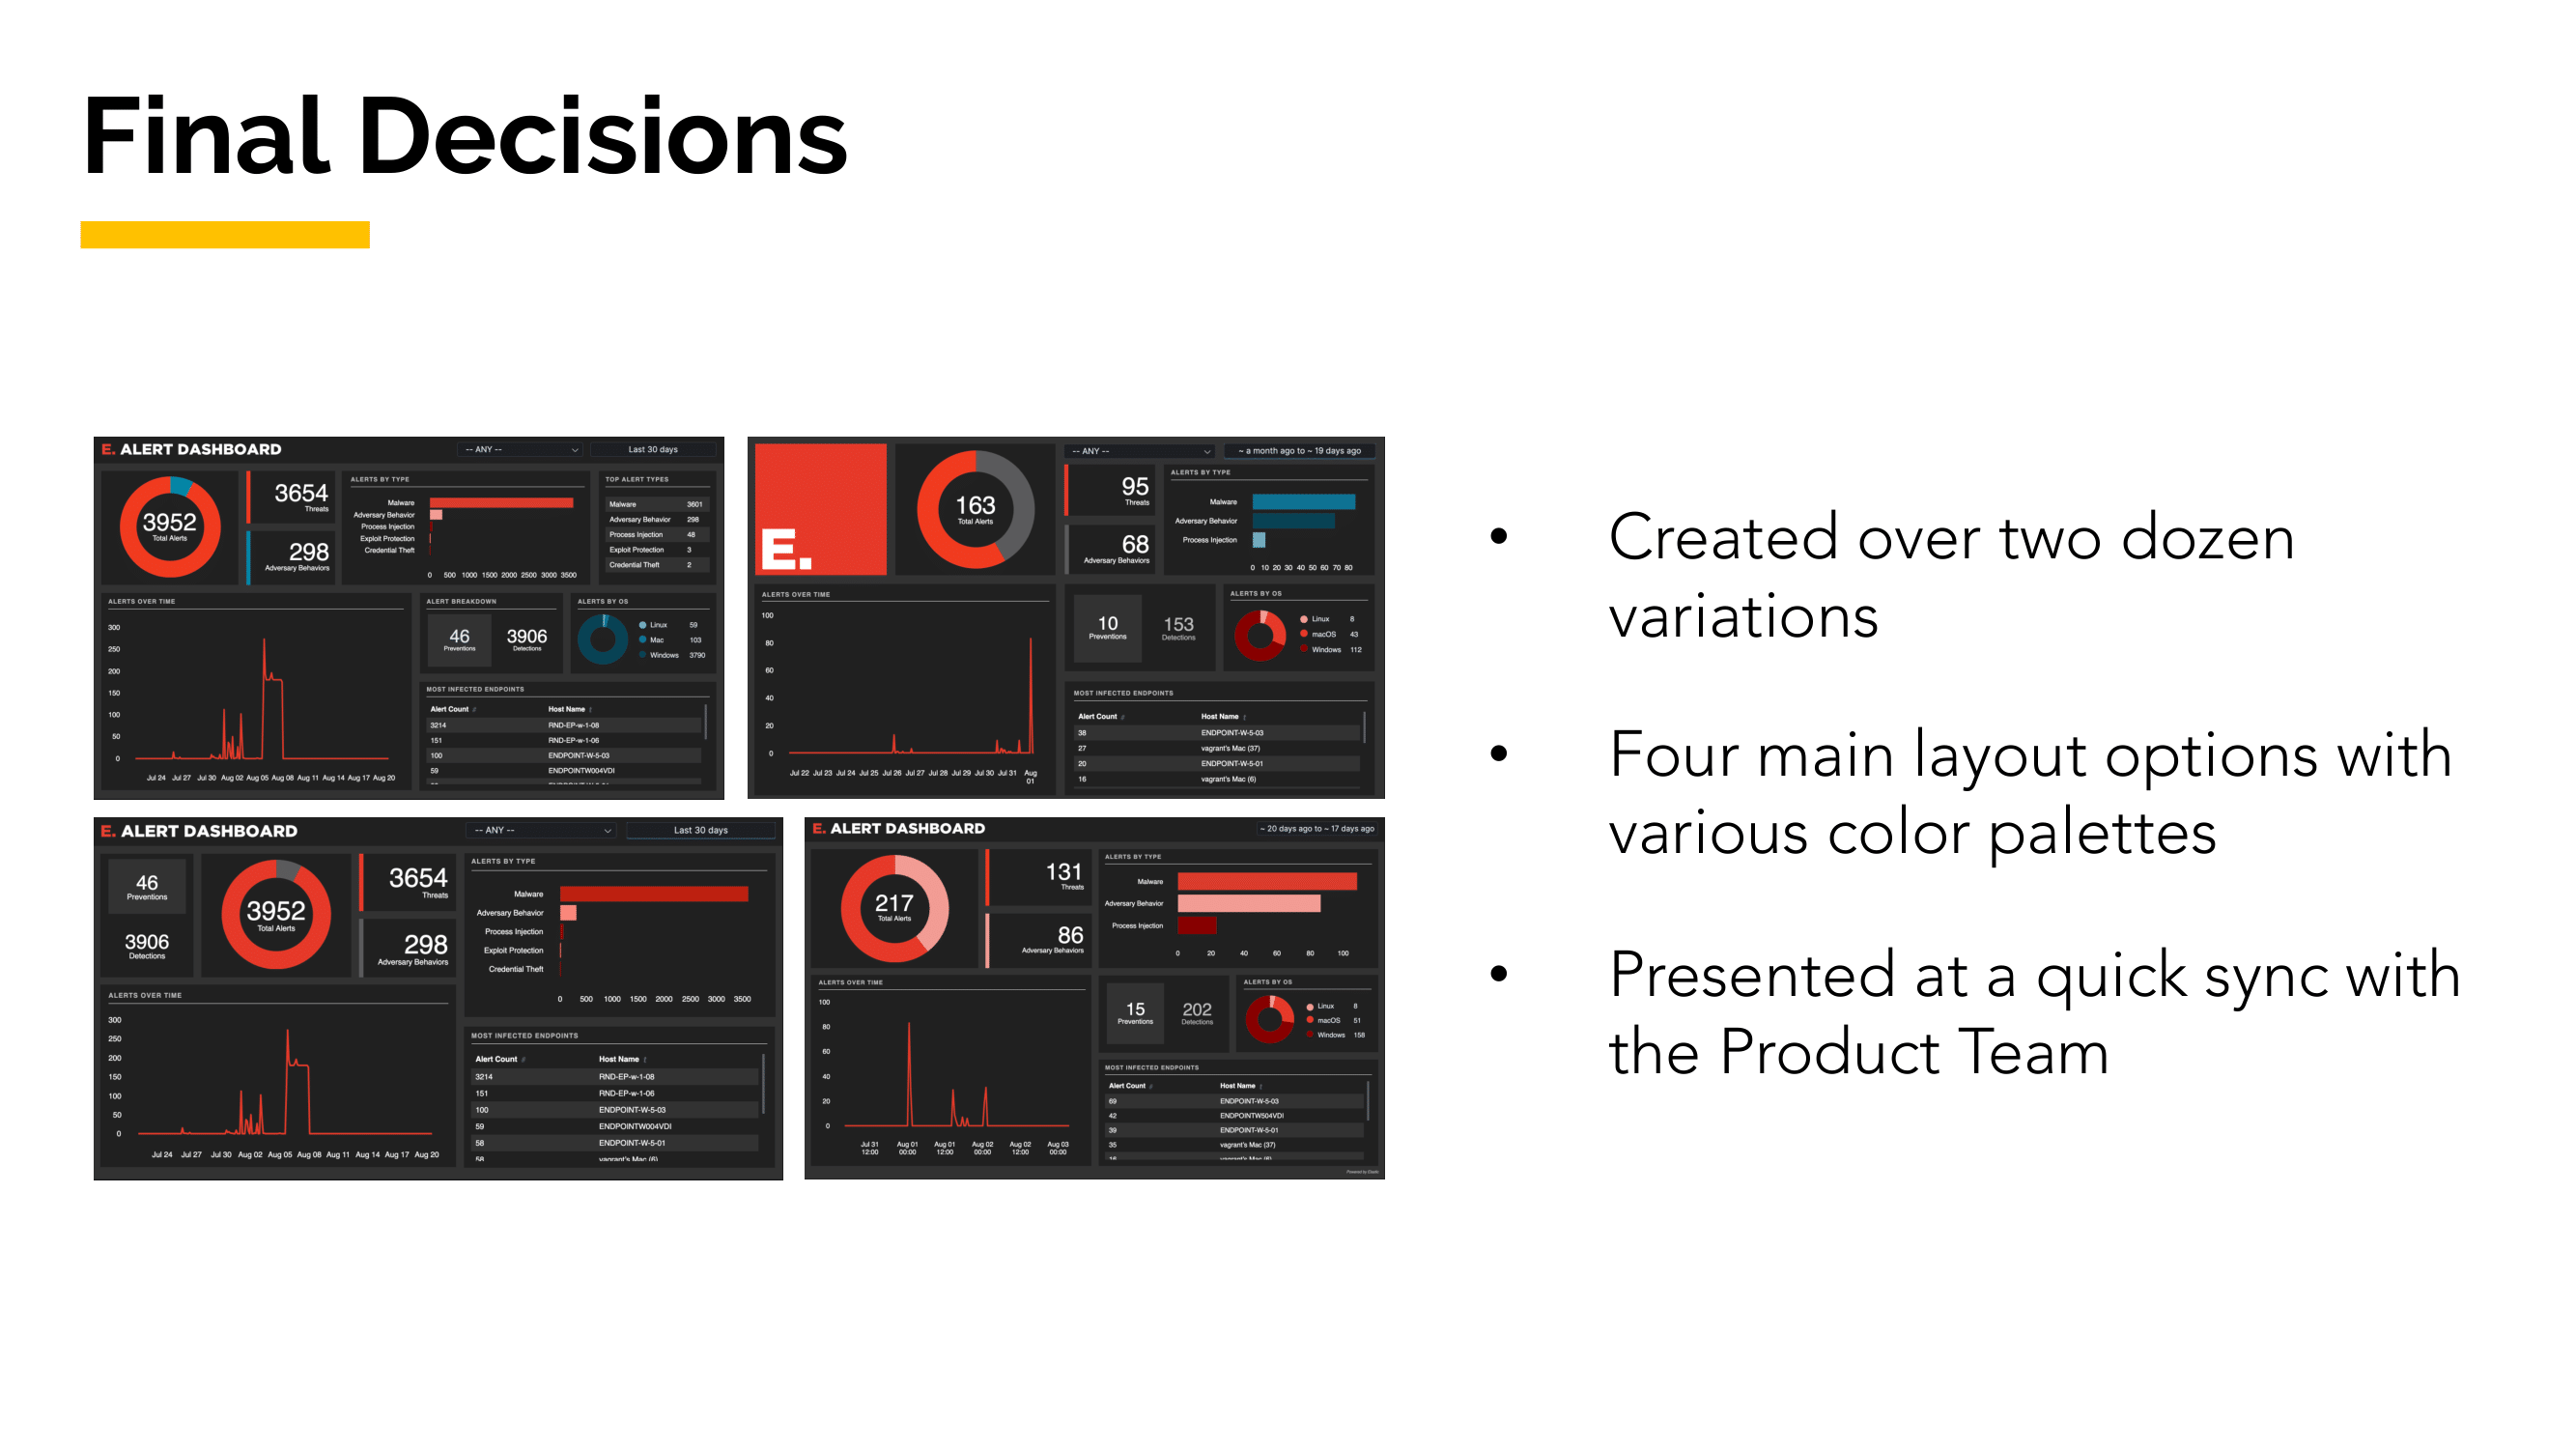
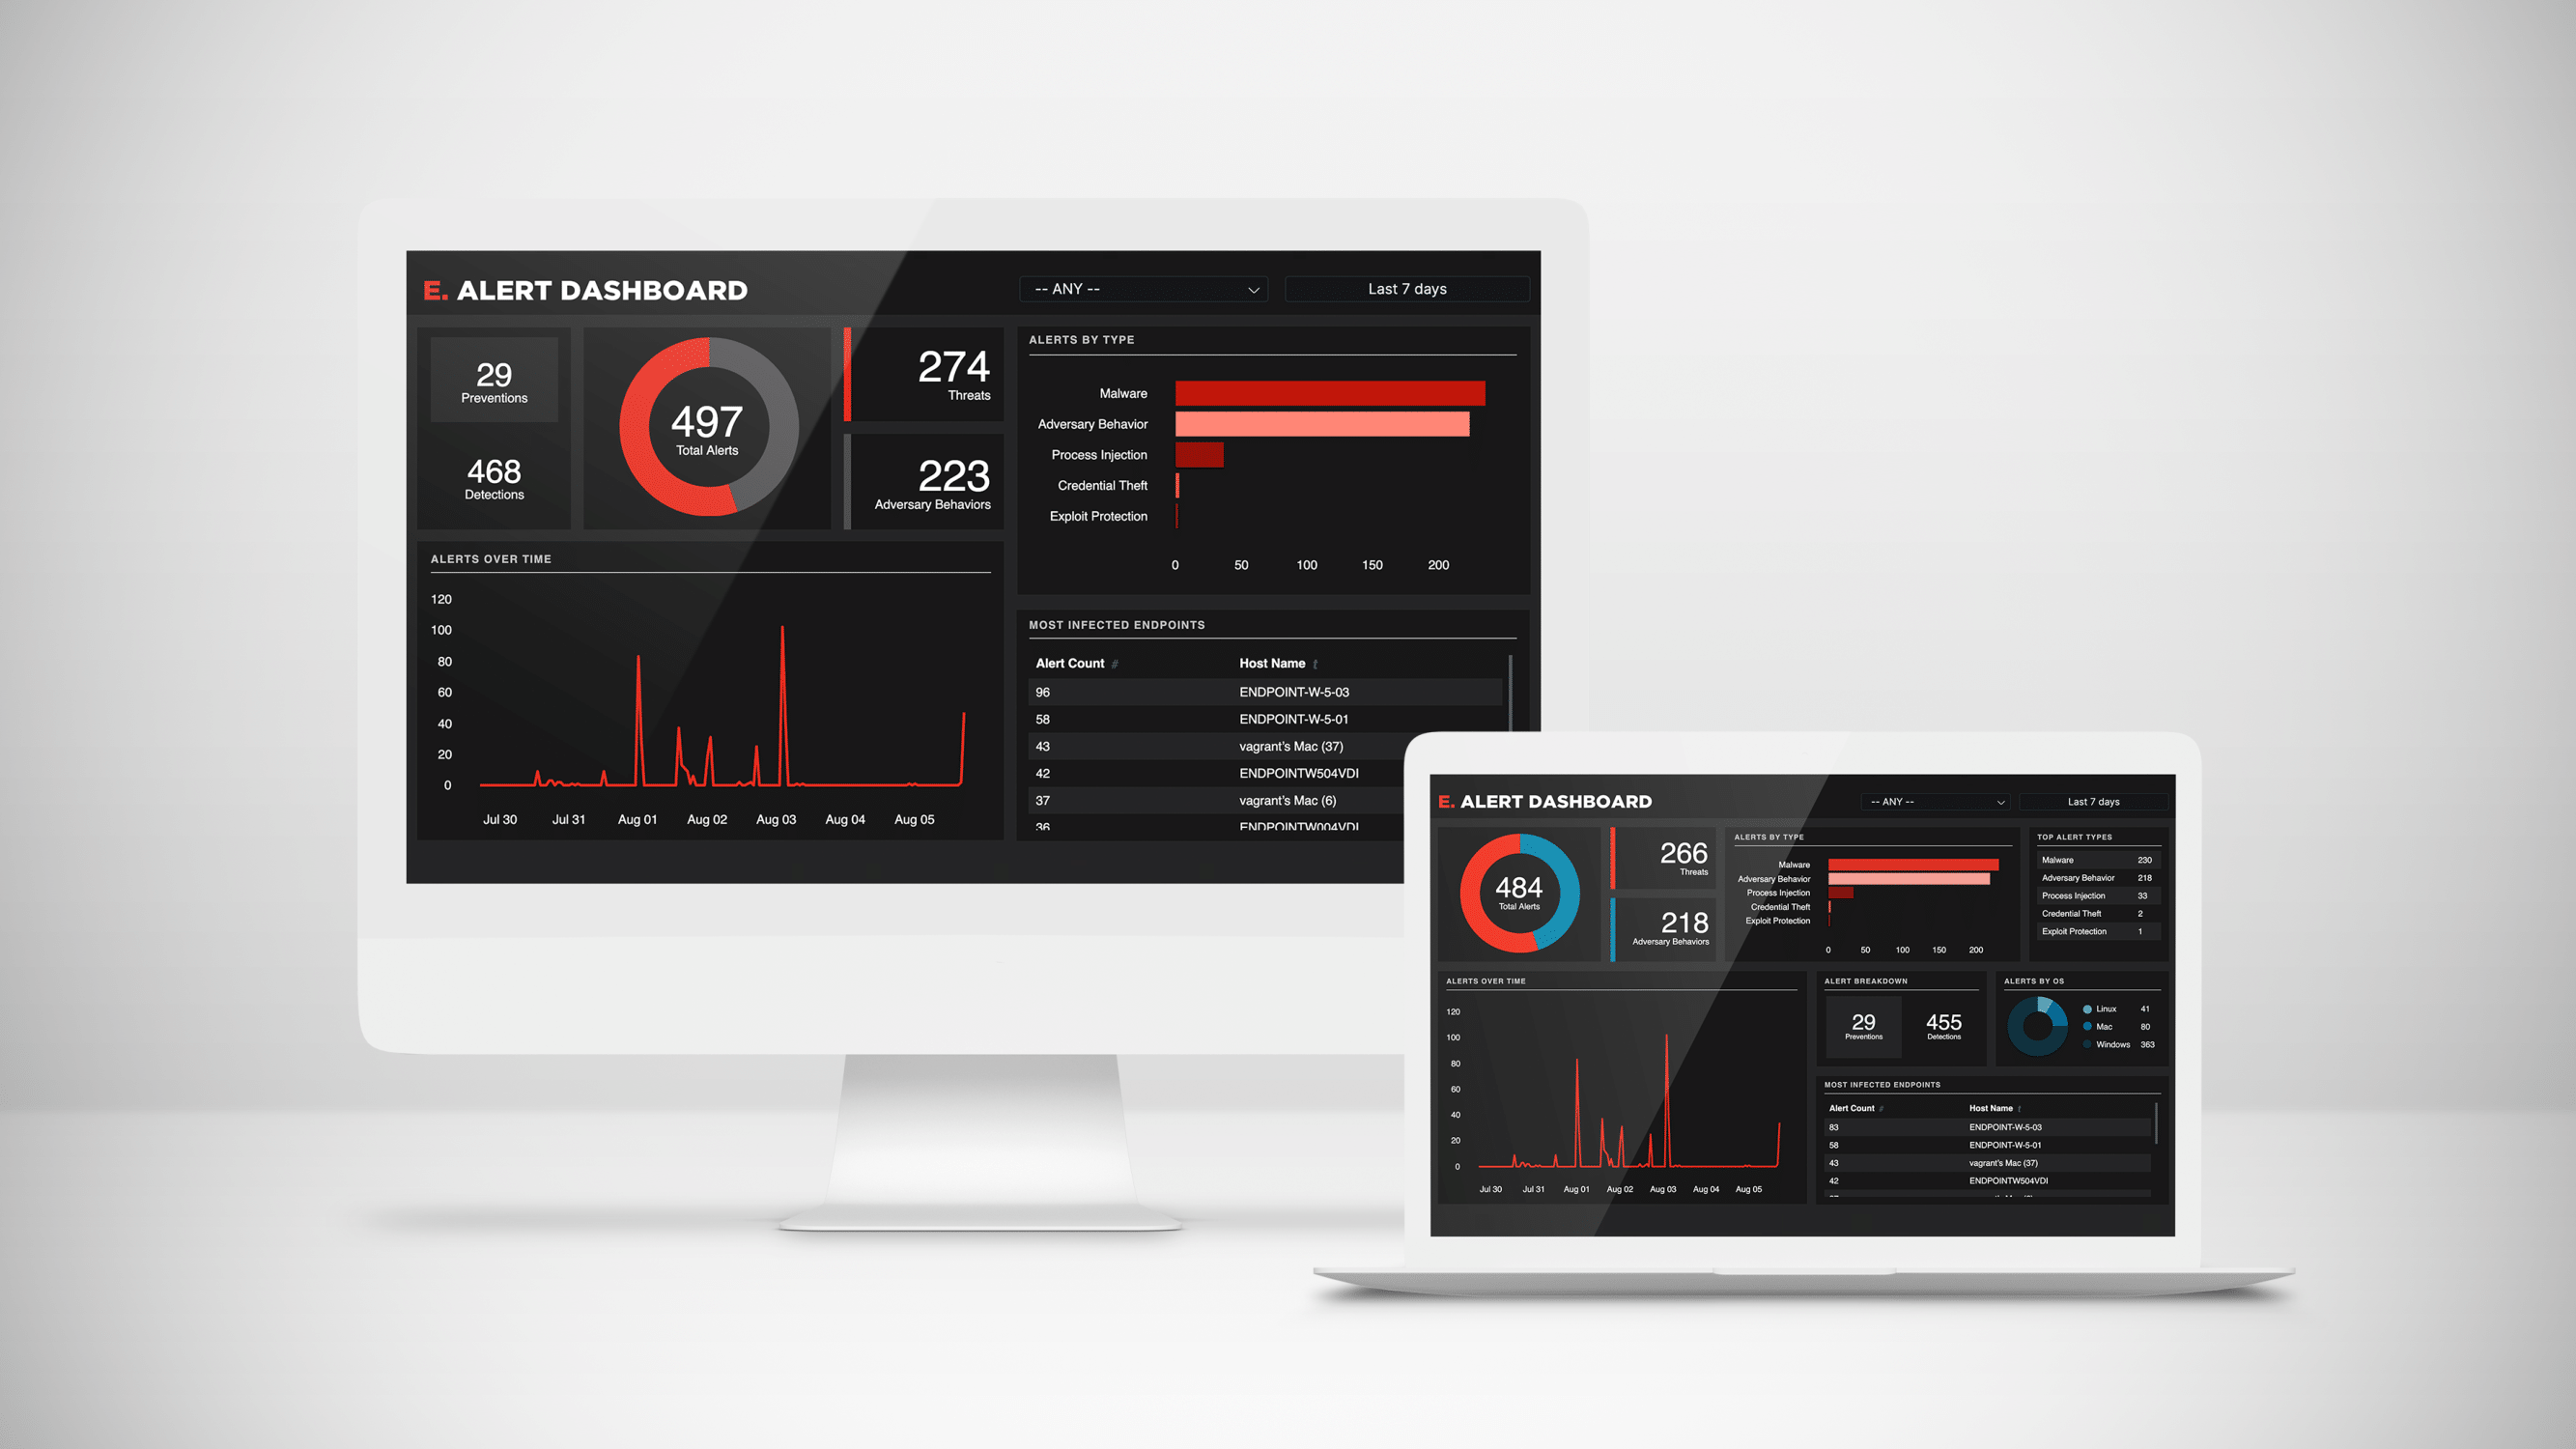
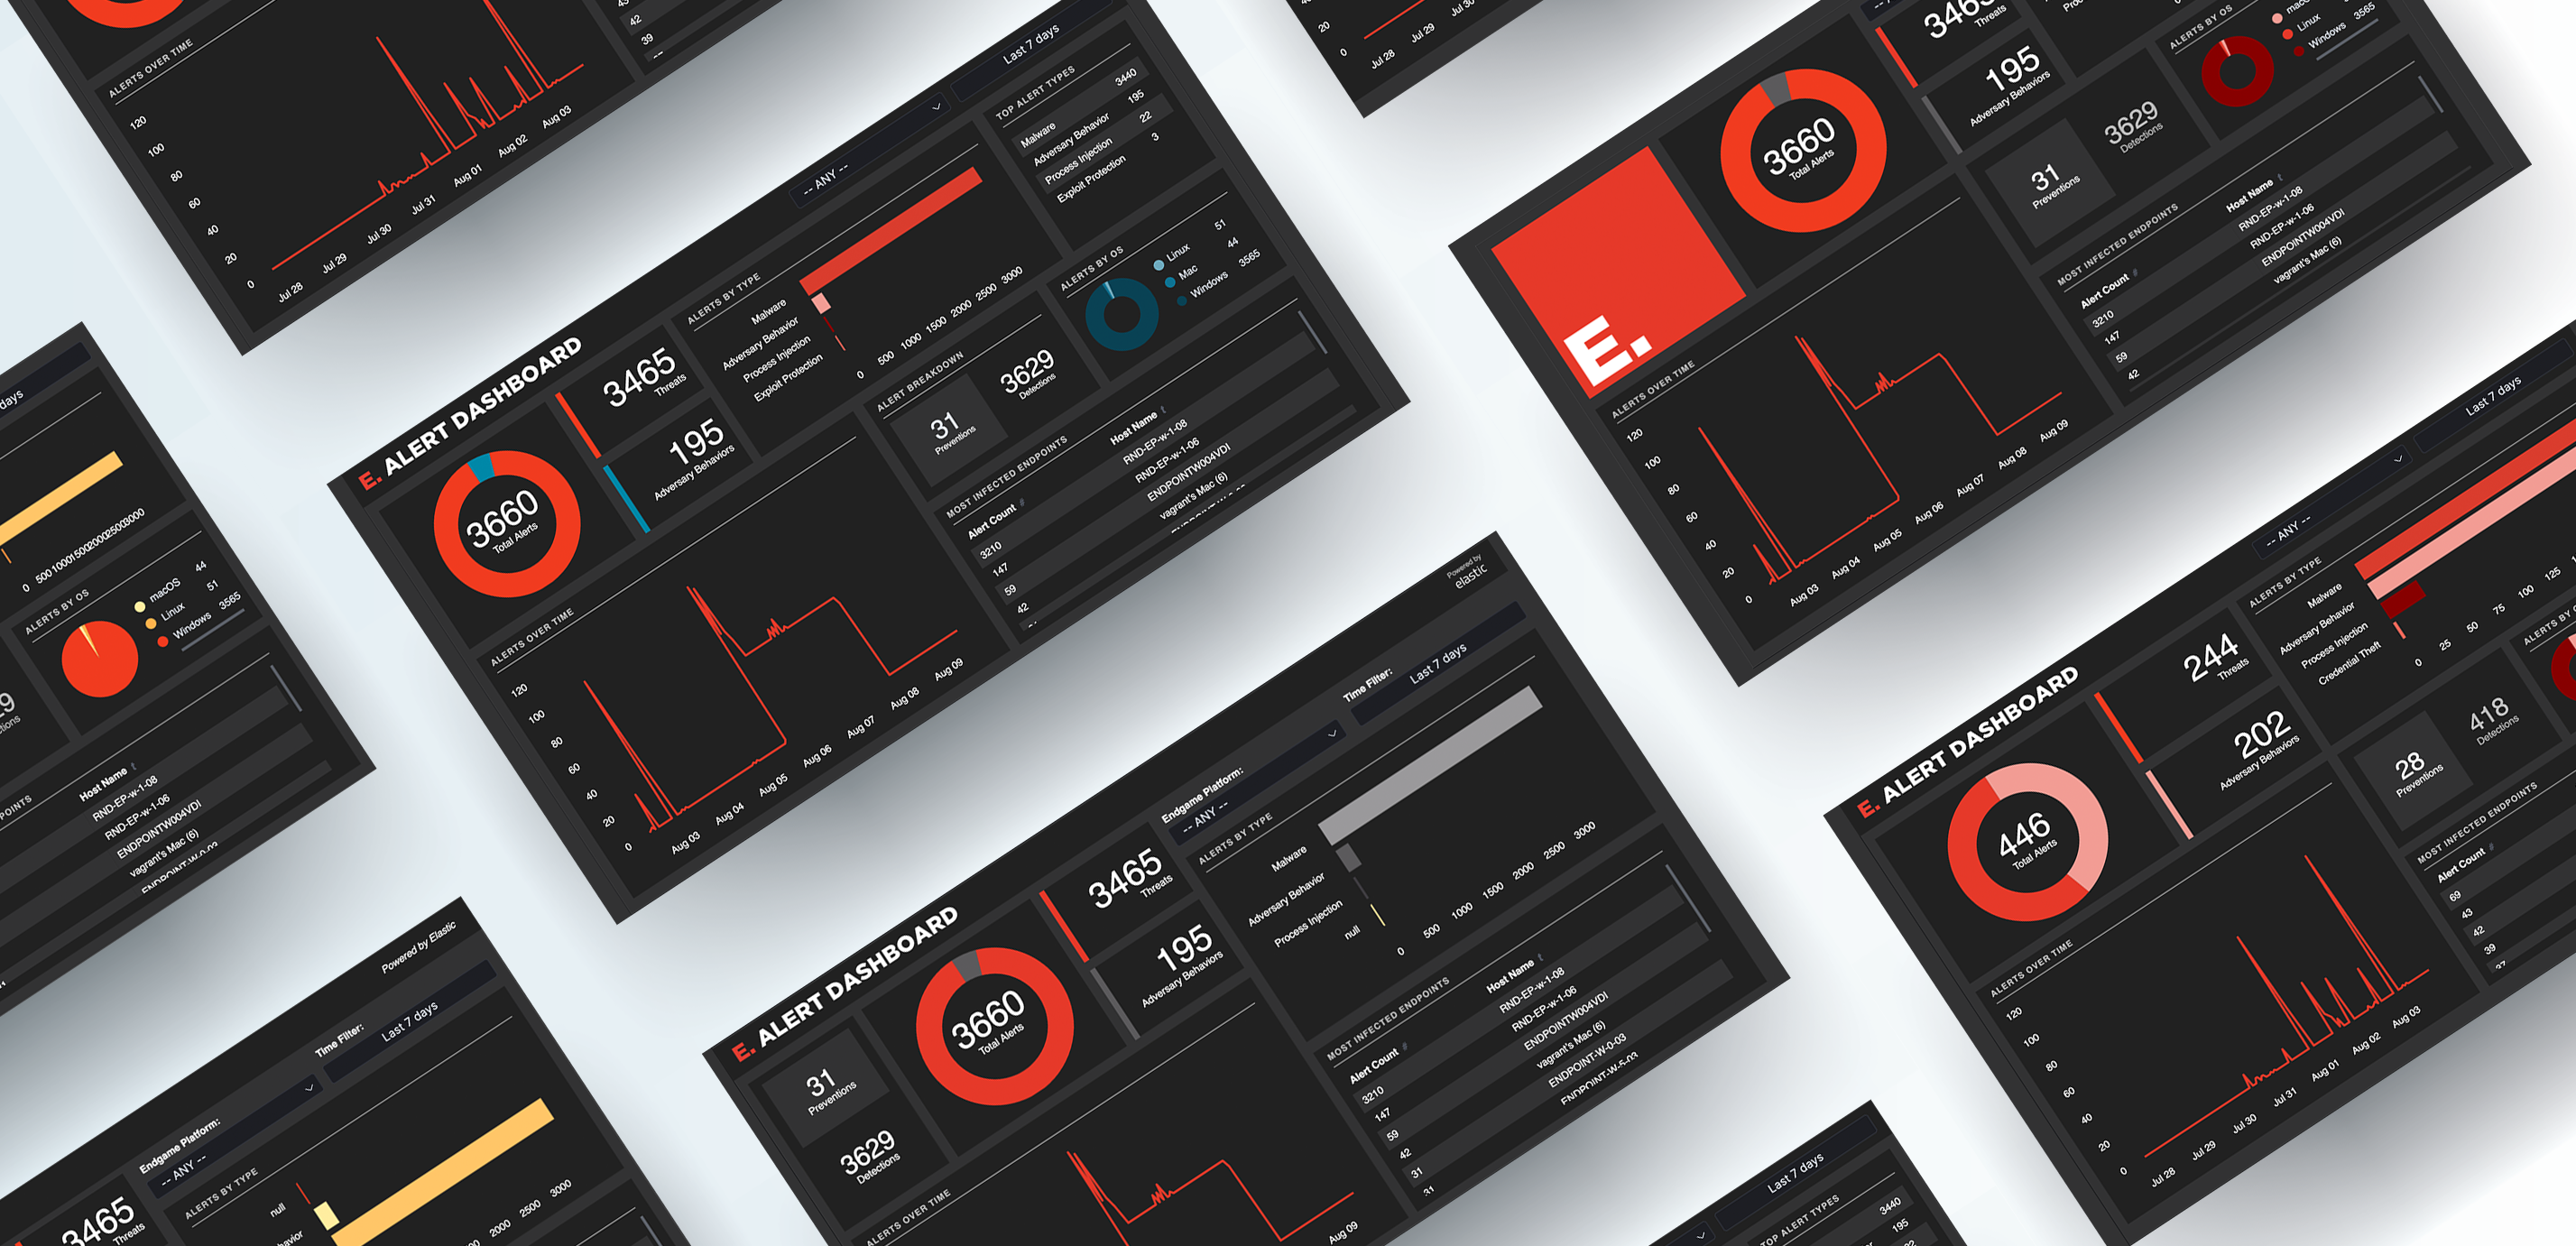
As we wanted to highlight the customization options Canvas provided, I selected two dashboards for the final deliverable: one with a general overview and one that was more detailed. All the metrics displayed on these dashboards were chosen to give SOC managers a comprehensive overview of the current health of their environment.
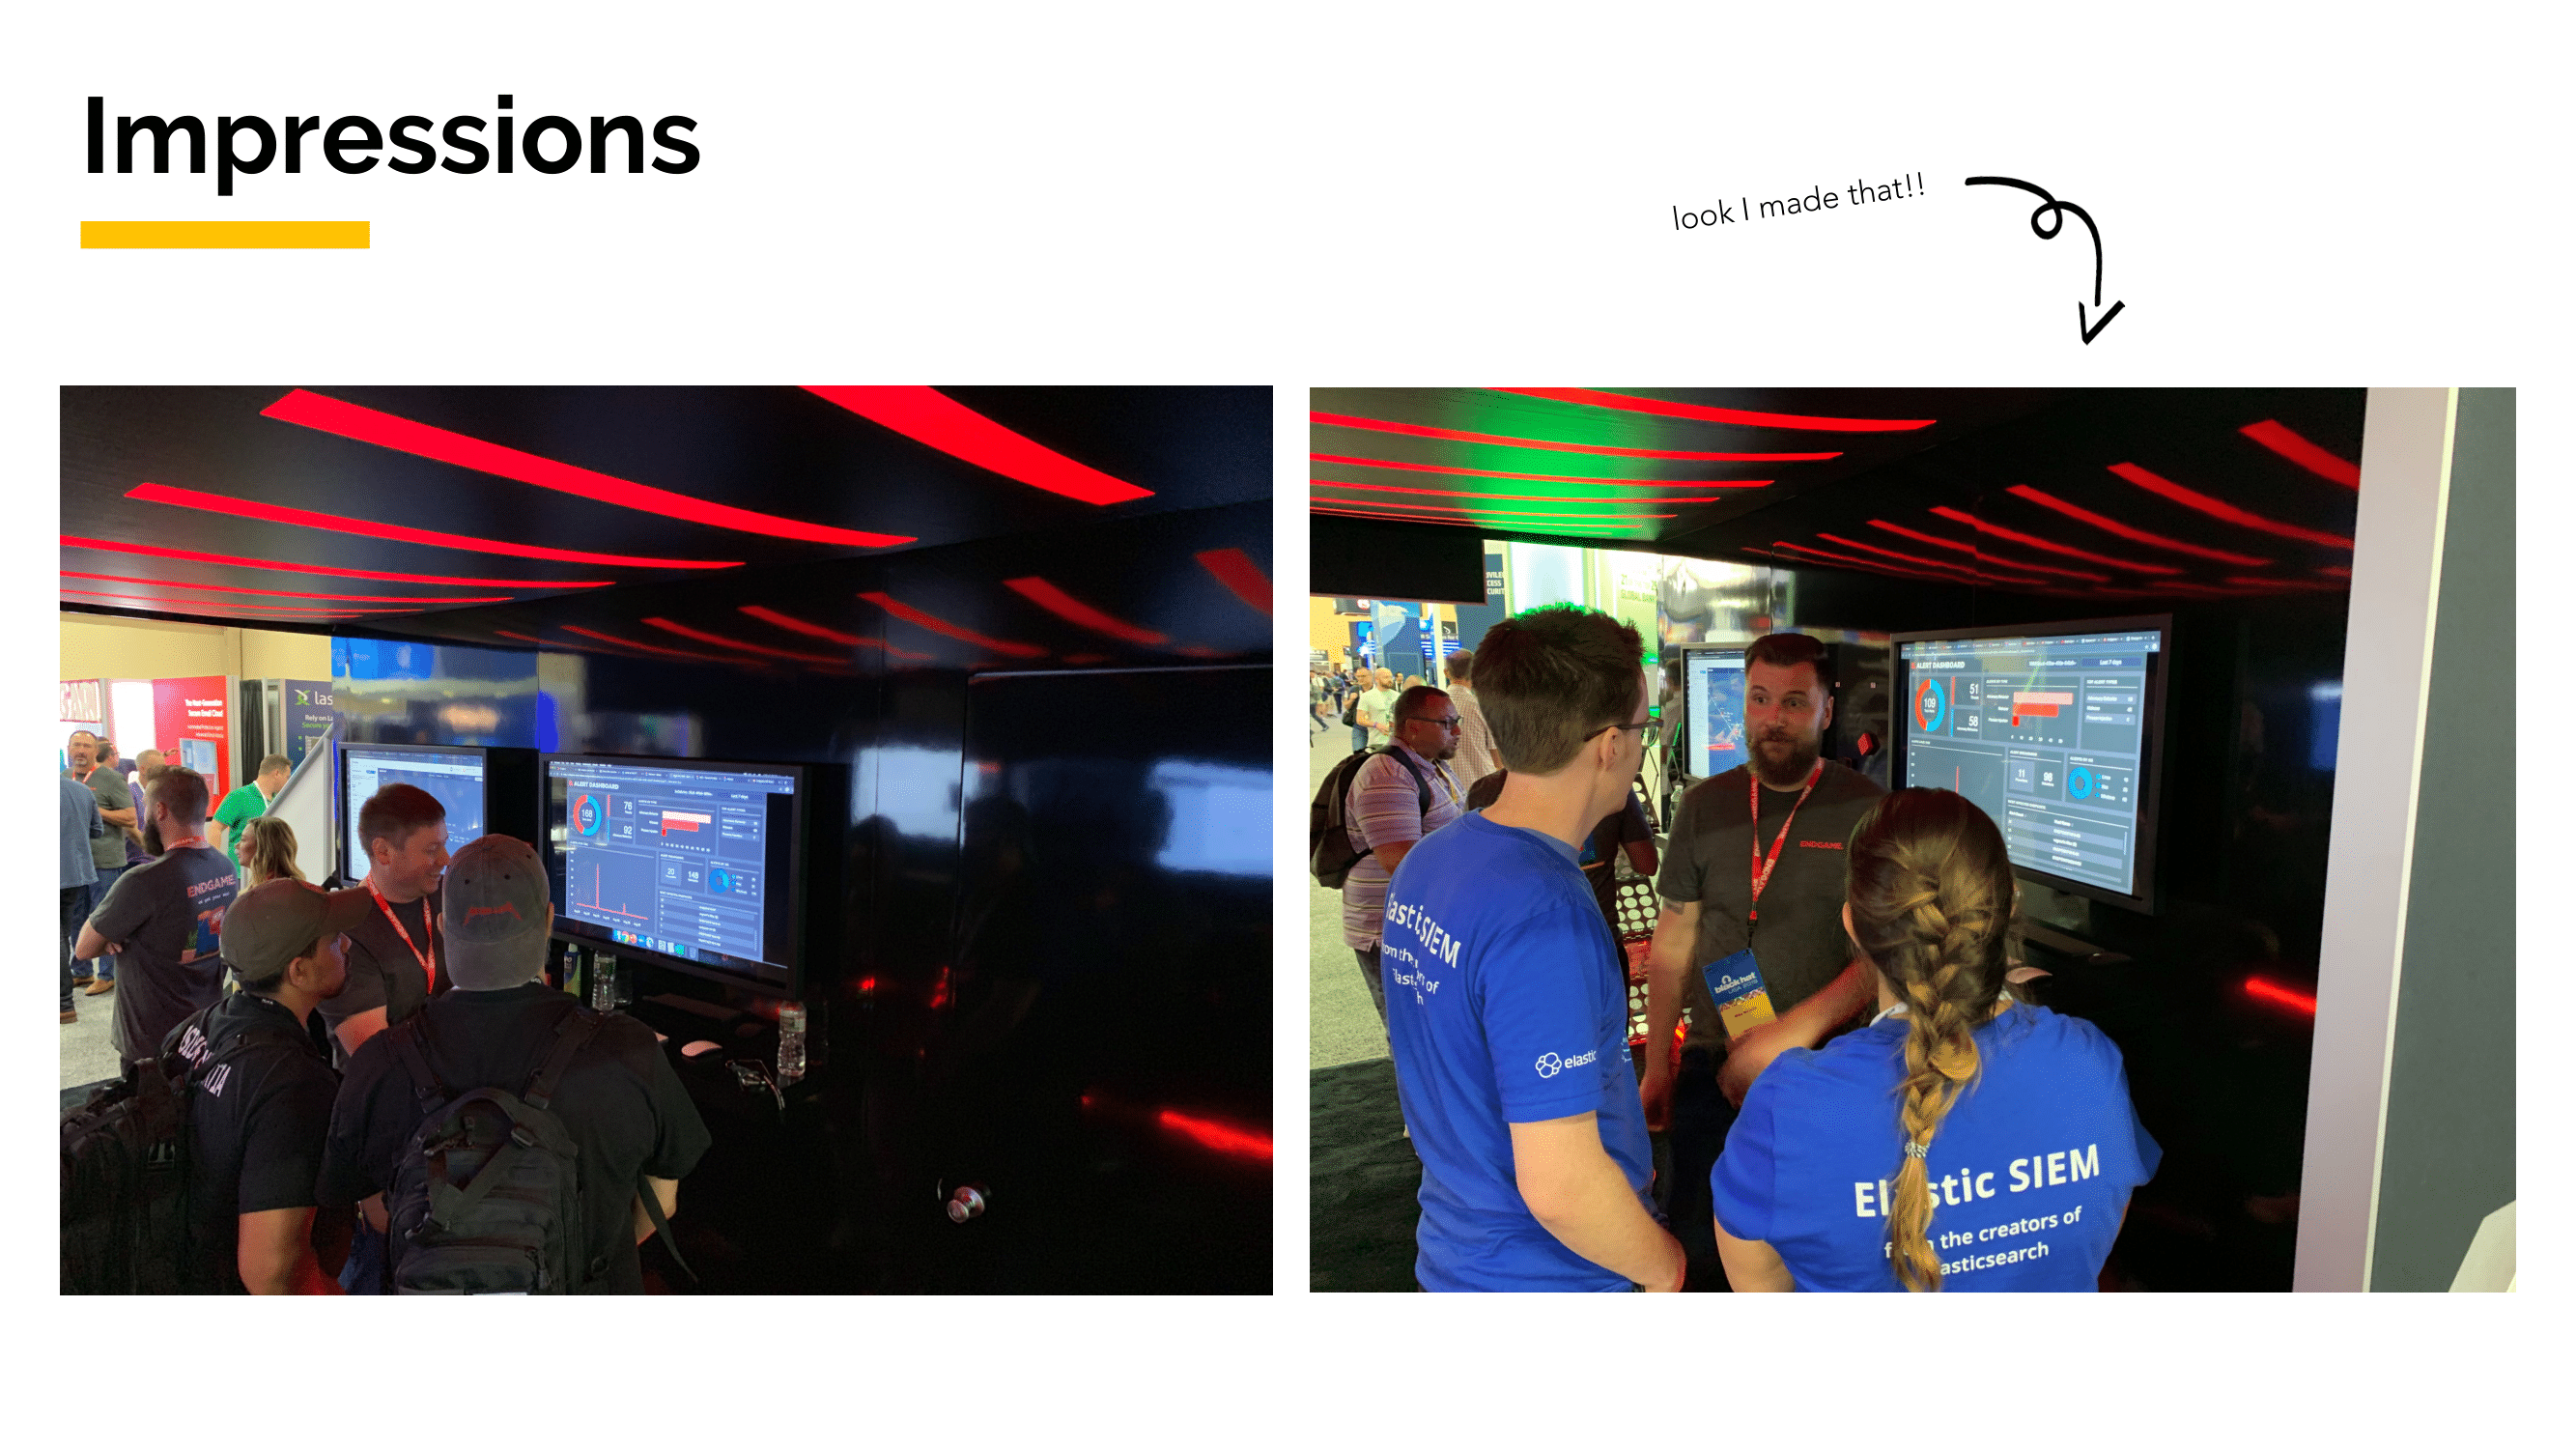
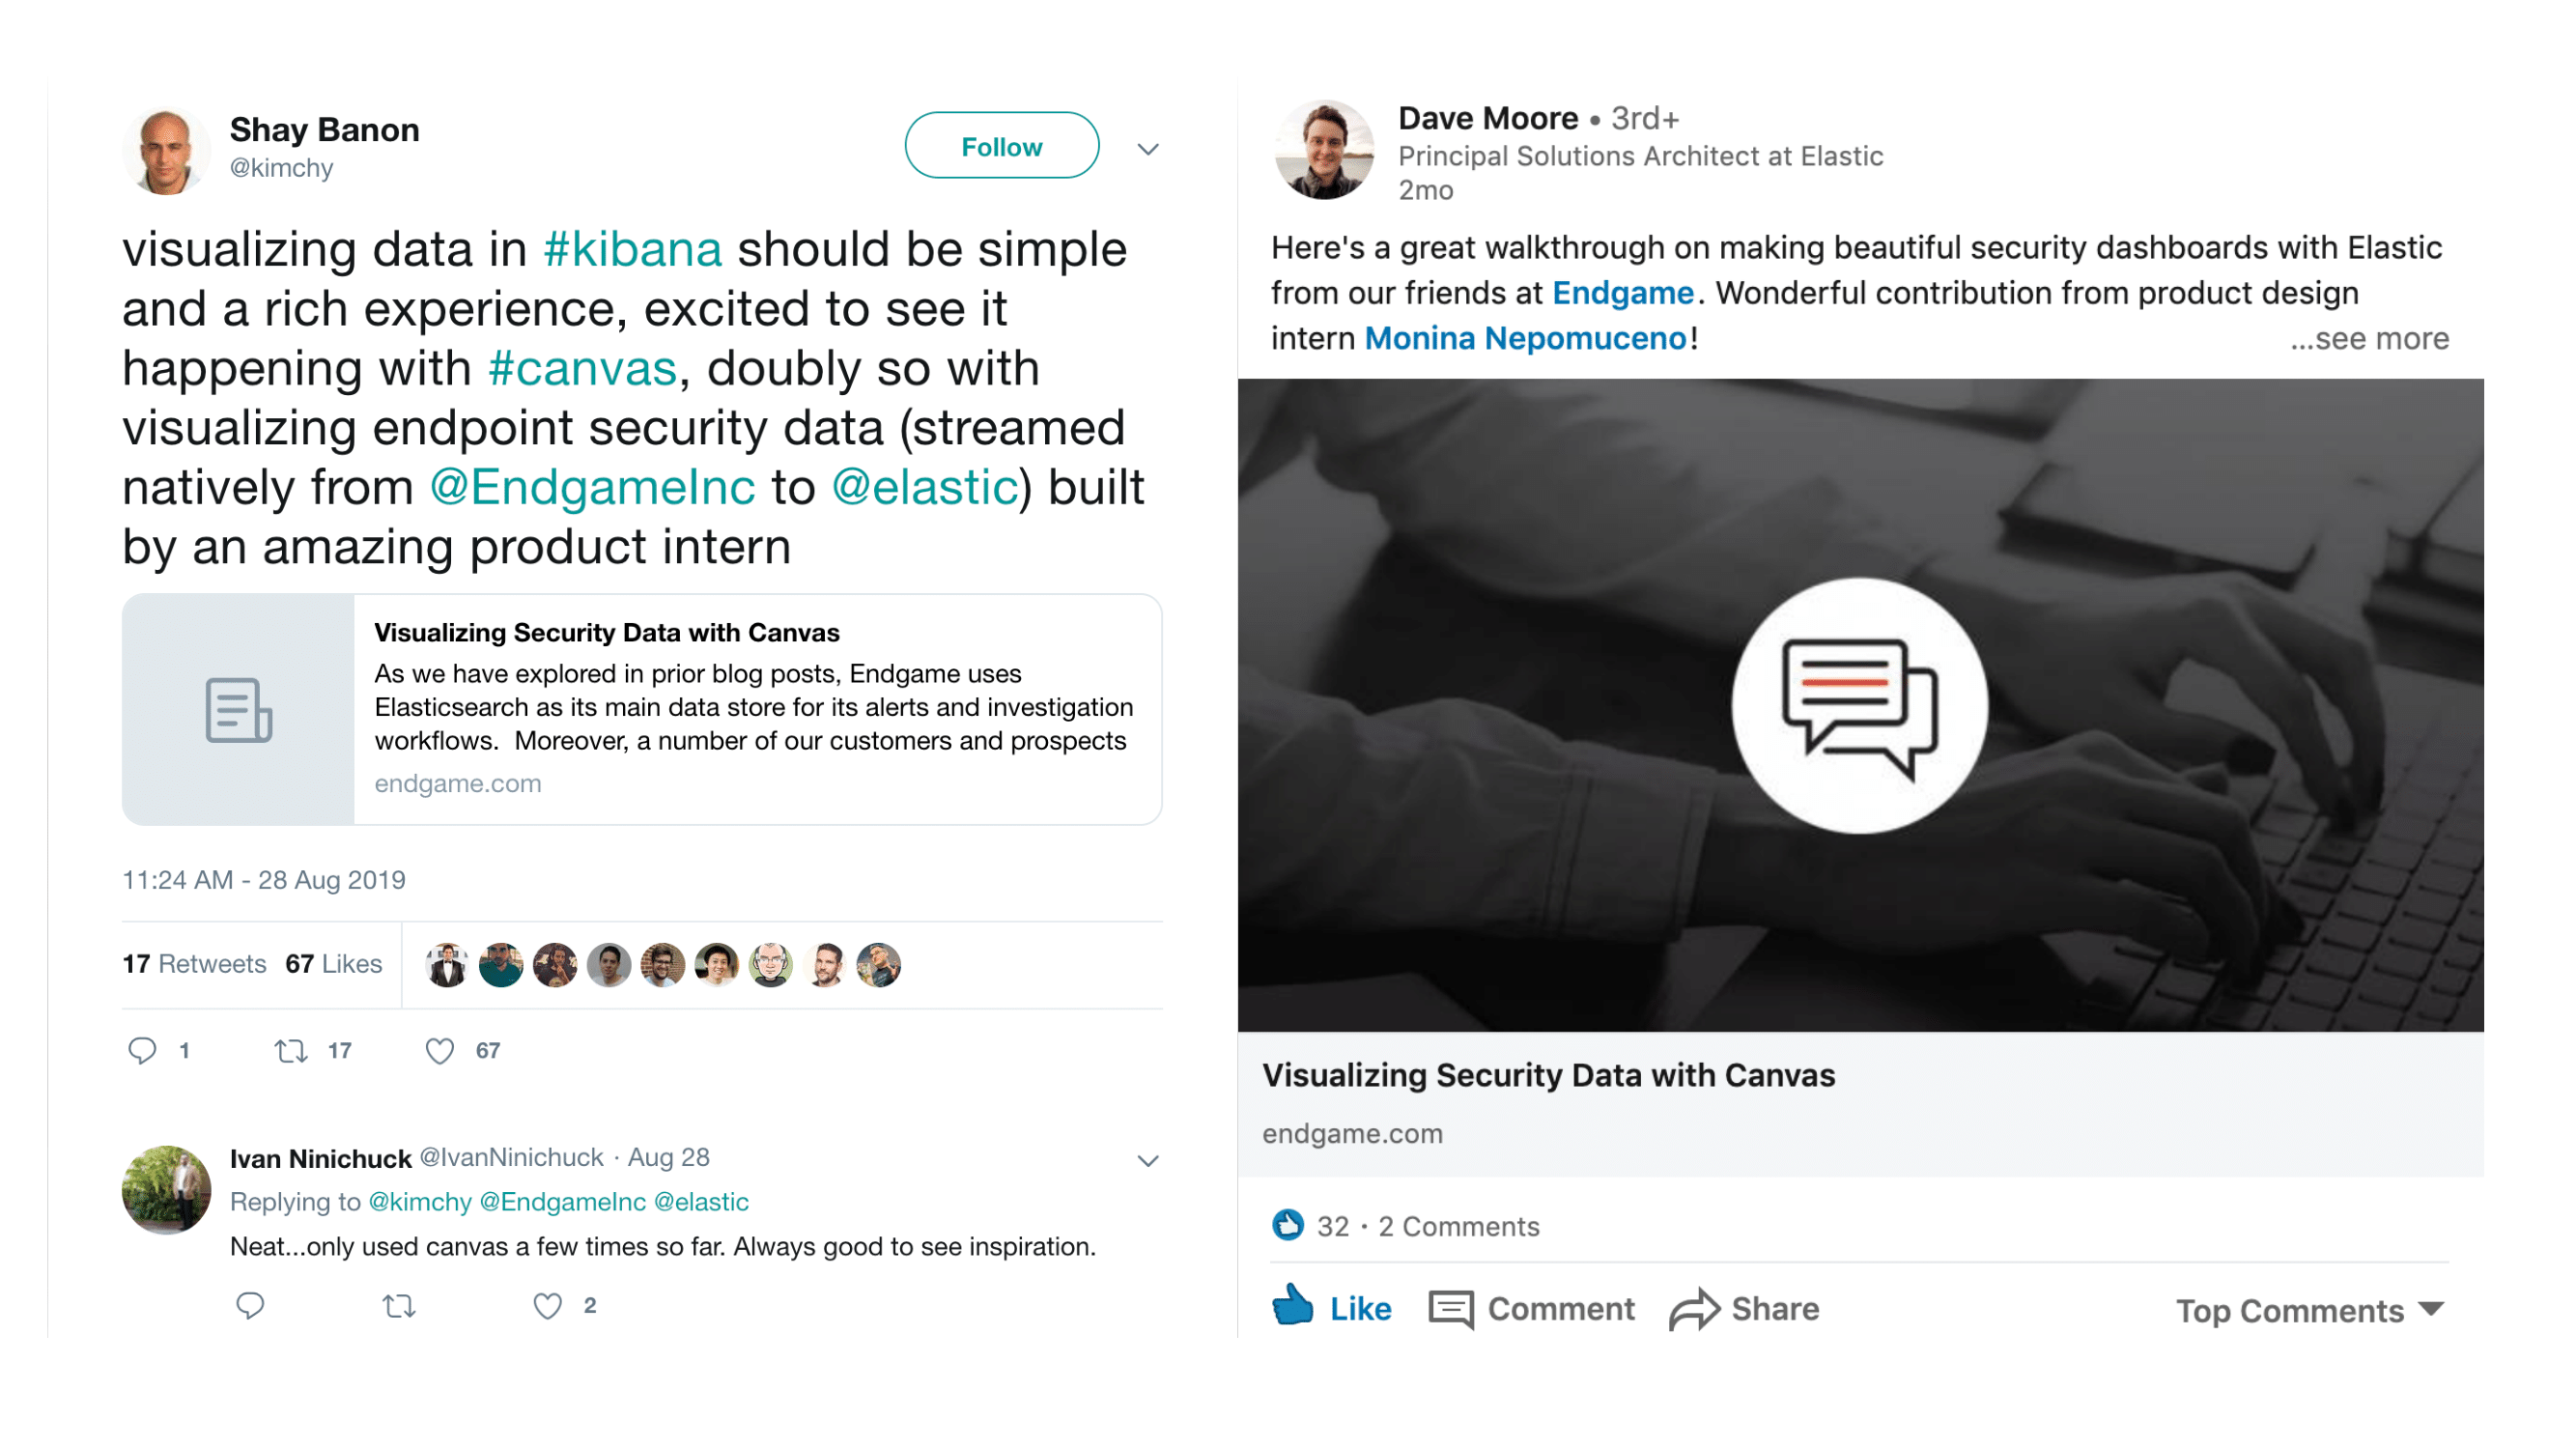
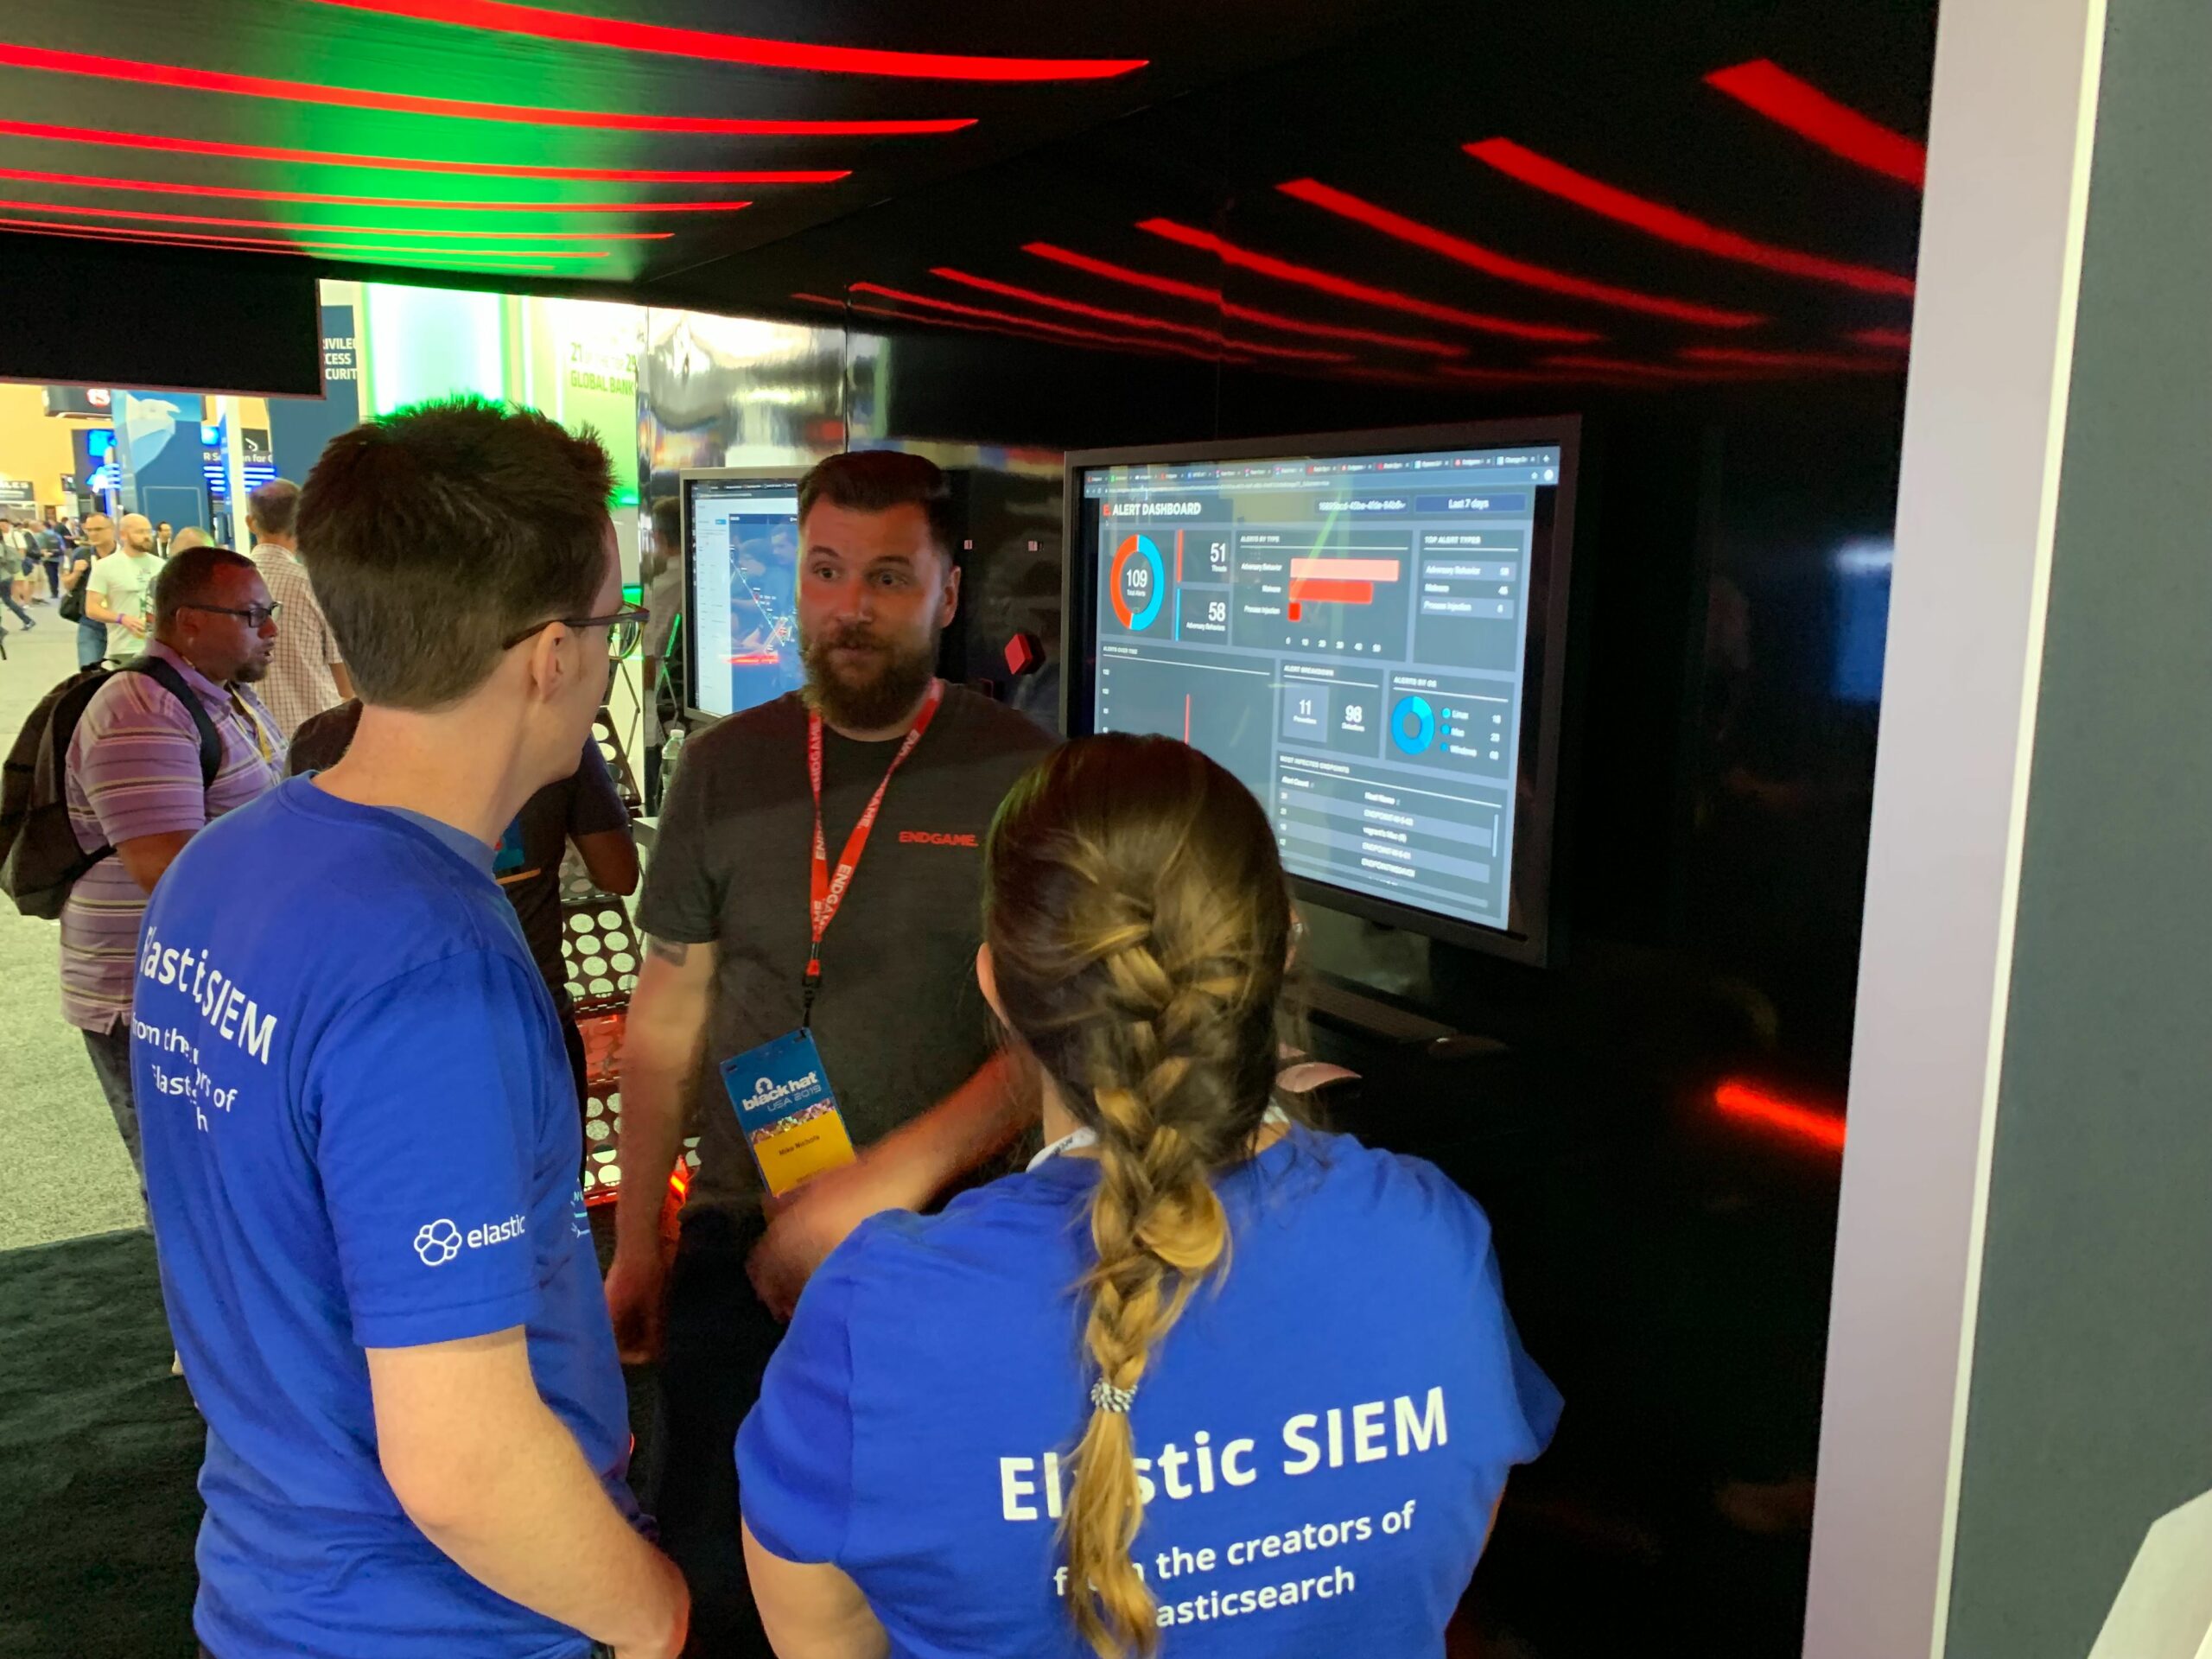
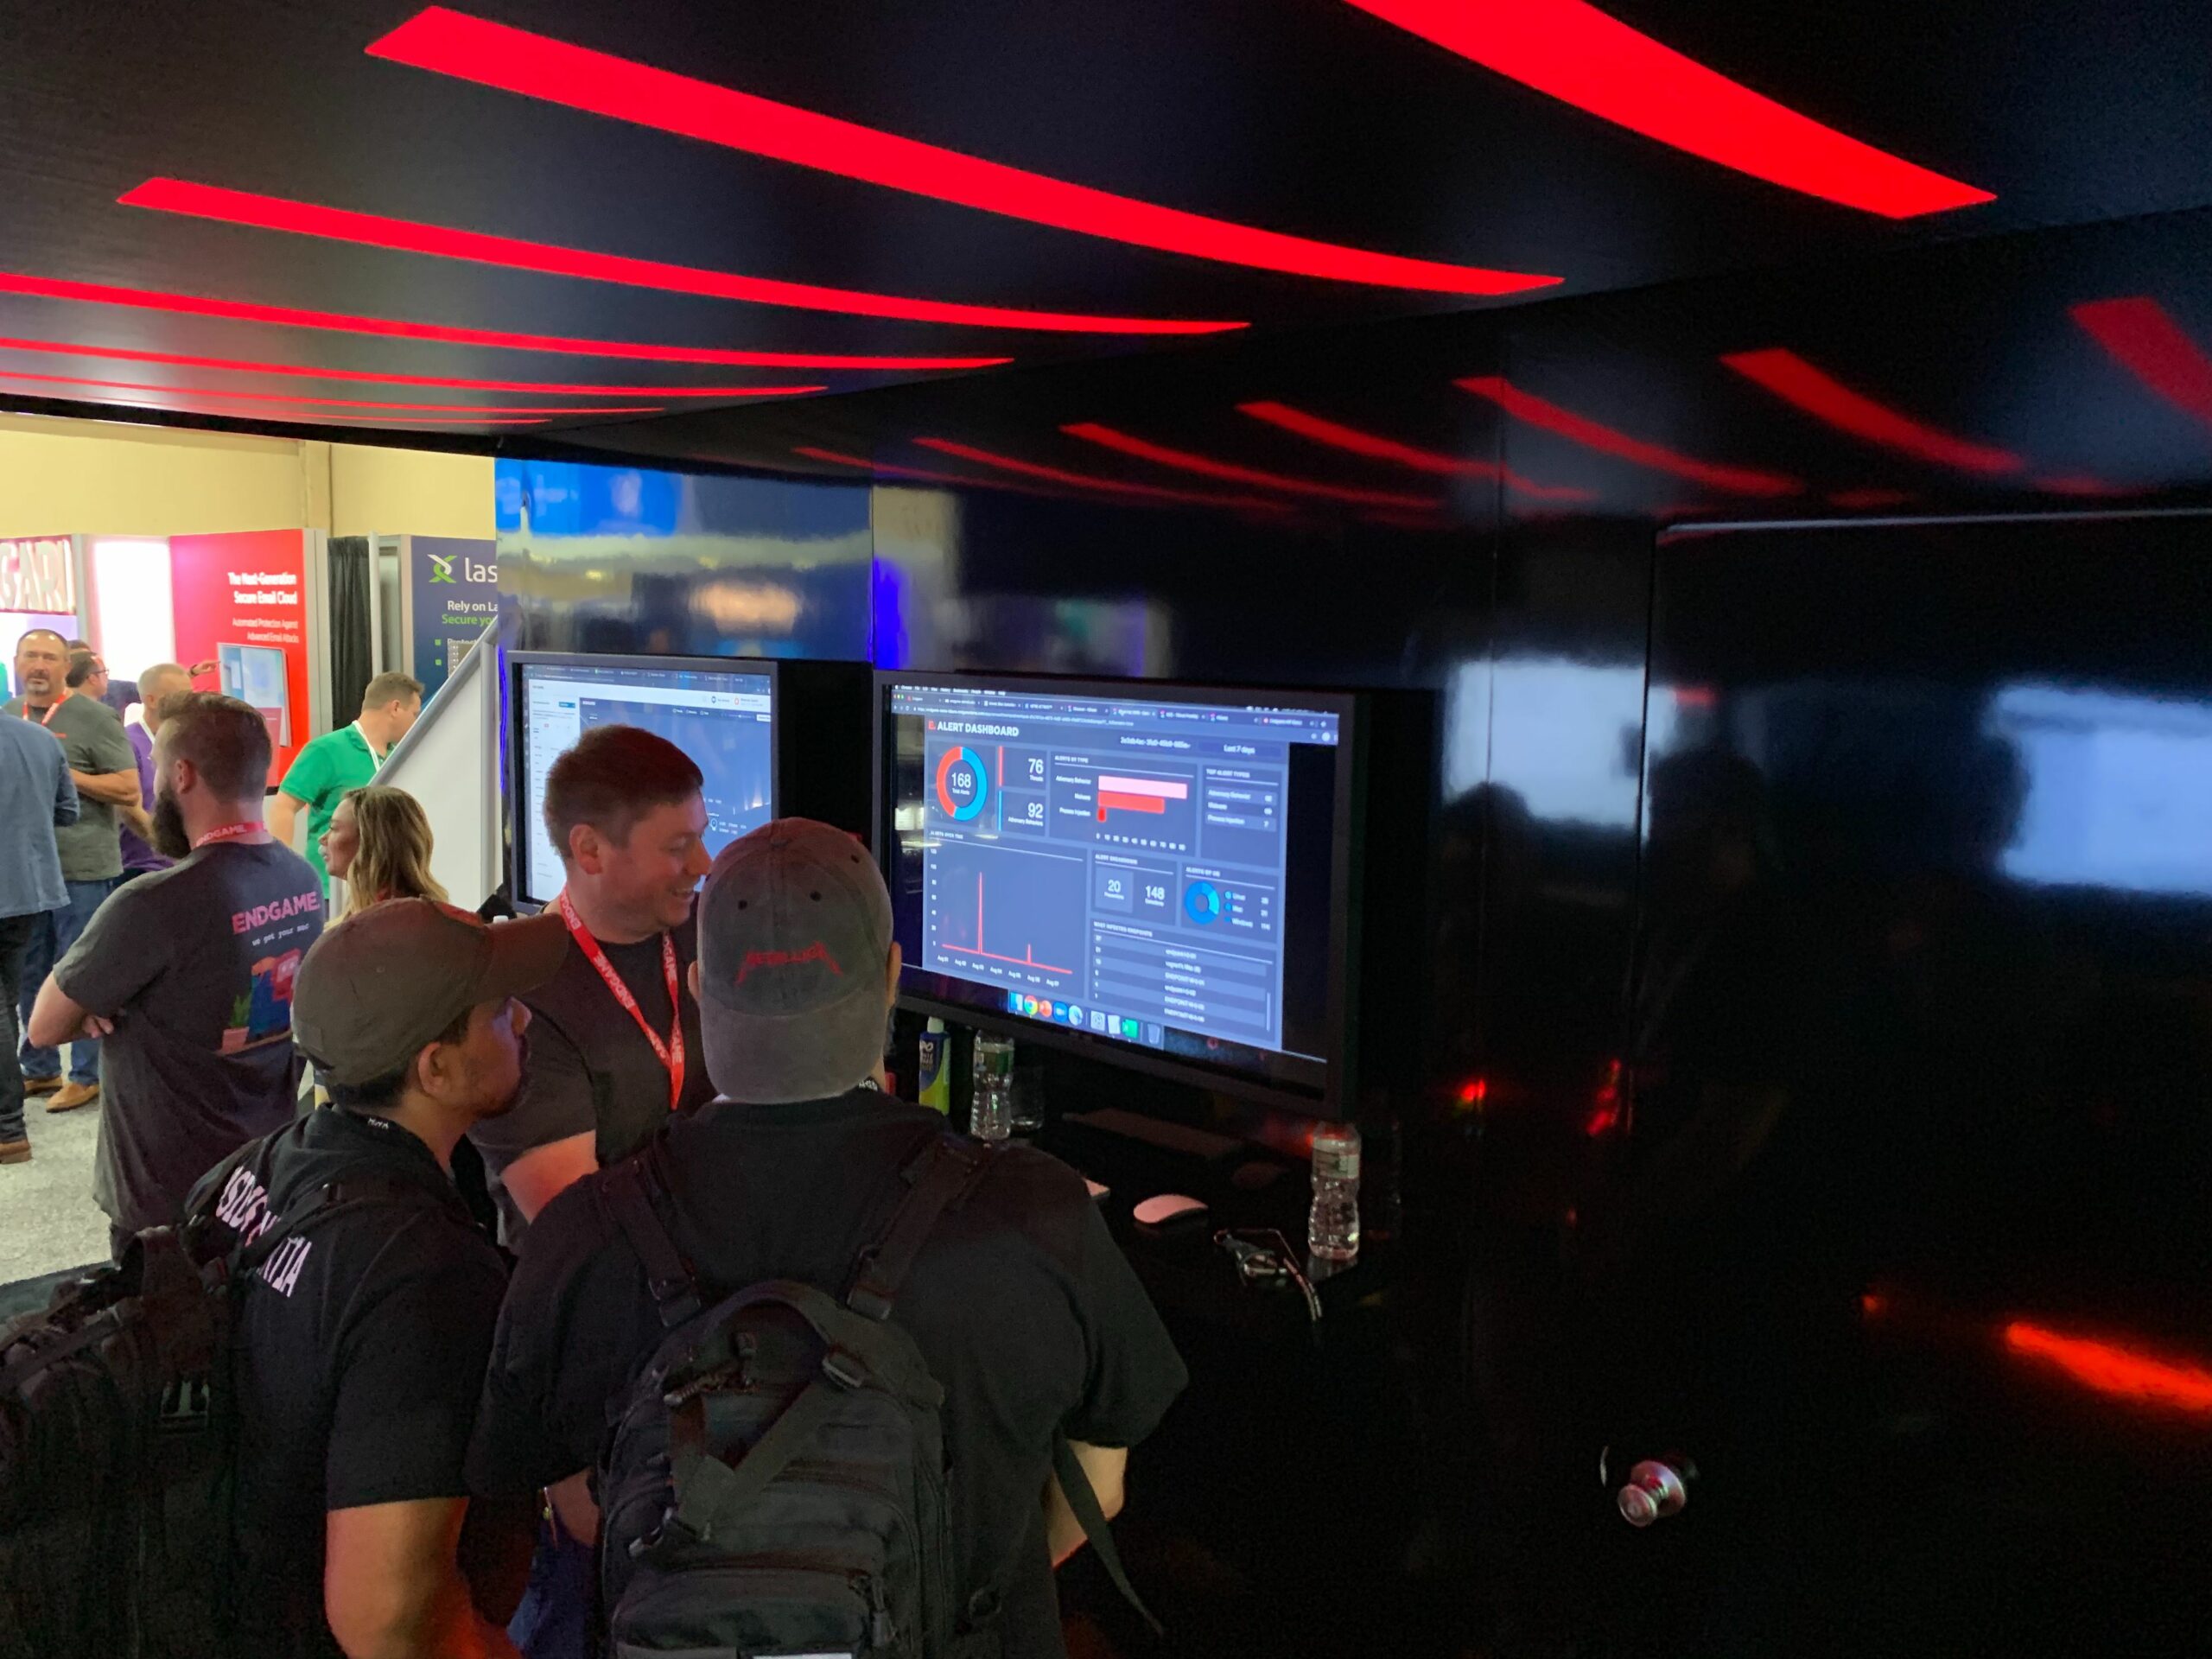
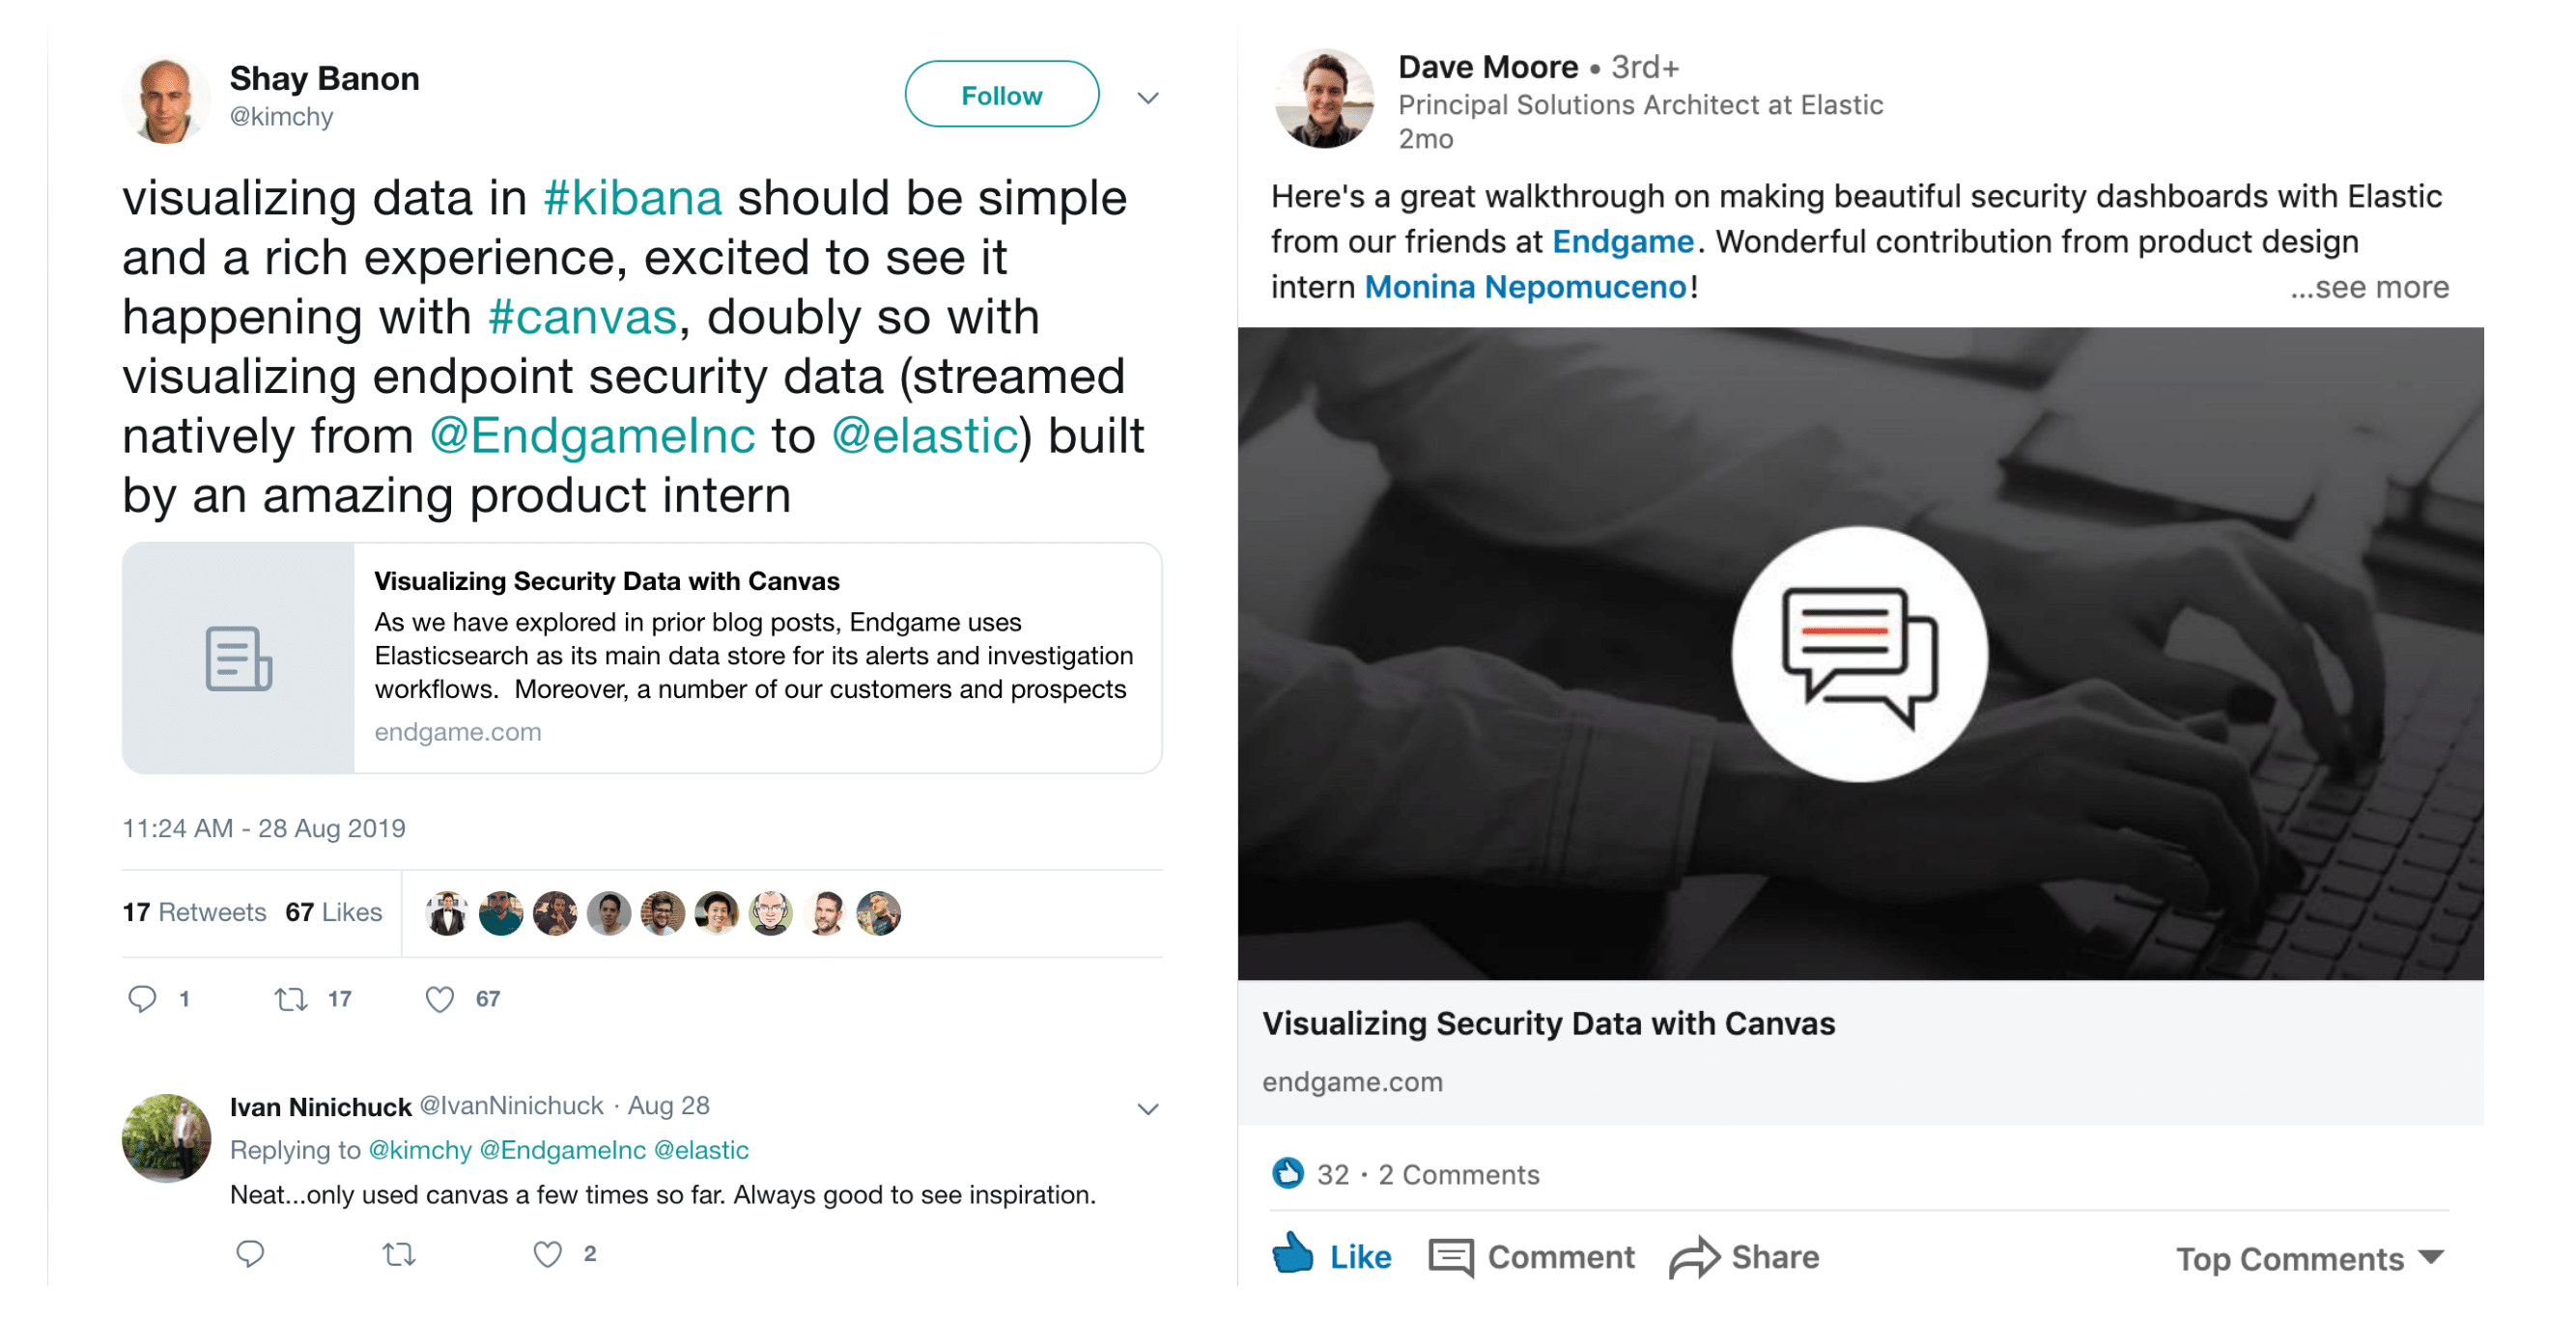
These dashboards were one of the main talking points of our Elastic Stack integration feature at Black Hat 2019. Our booth was one of the busiest on the show floor with over thousands of visitors throughout the conference. Many of these attendees were excited to see possibilities with the Endgame and Elastic integration through our demo. It was also shared on various social media channels: on the Endgame blog, LinkedIn, and even the Elastic CEO's Twitter account. These dashboards teased the future of what the Elastic and Endgame acquisition could bring to security teams.
Other works
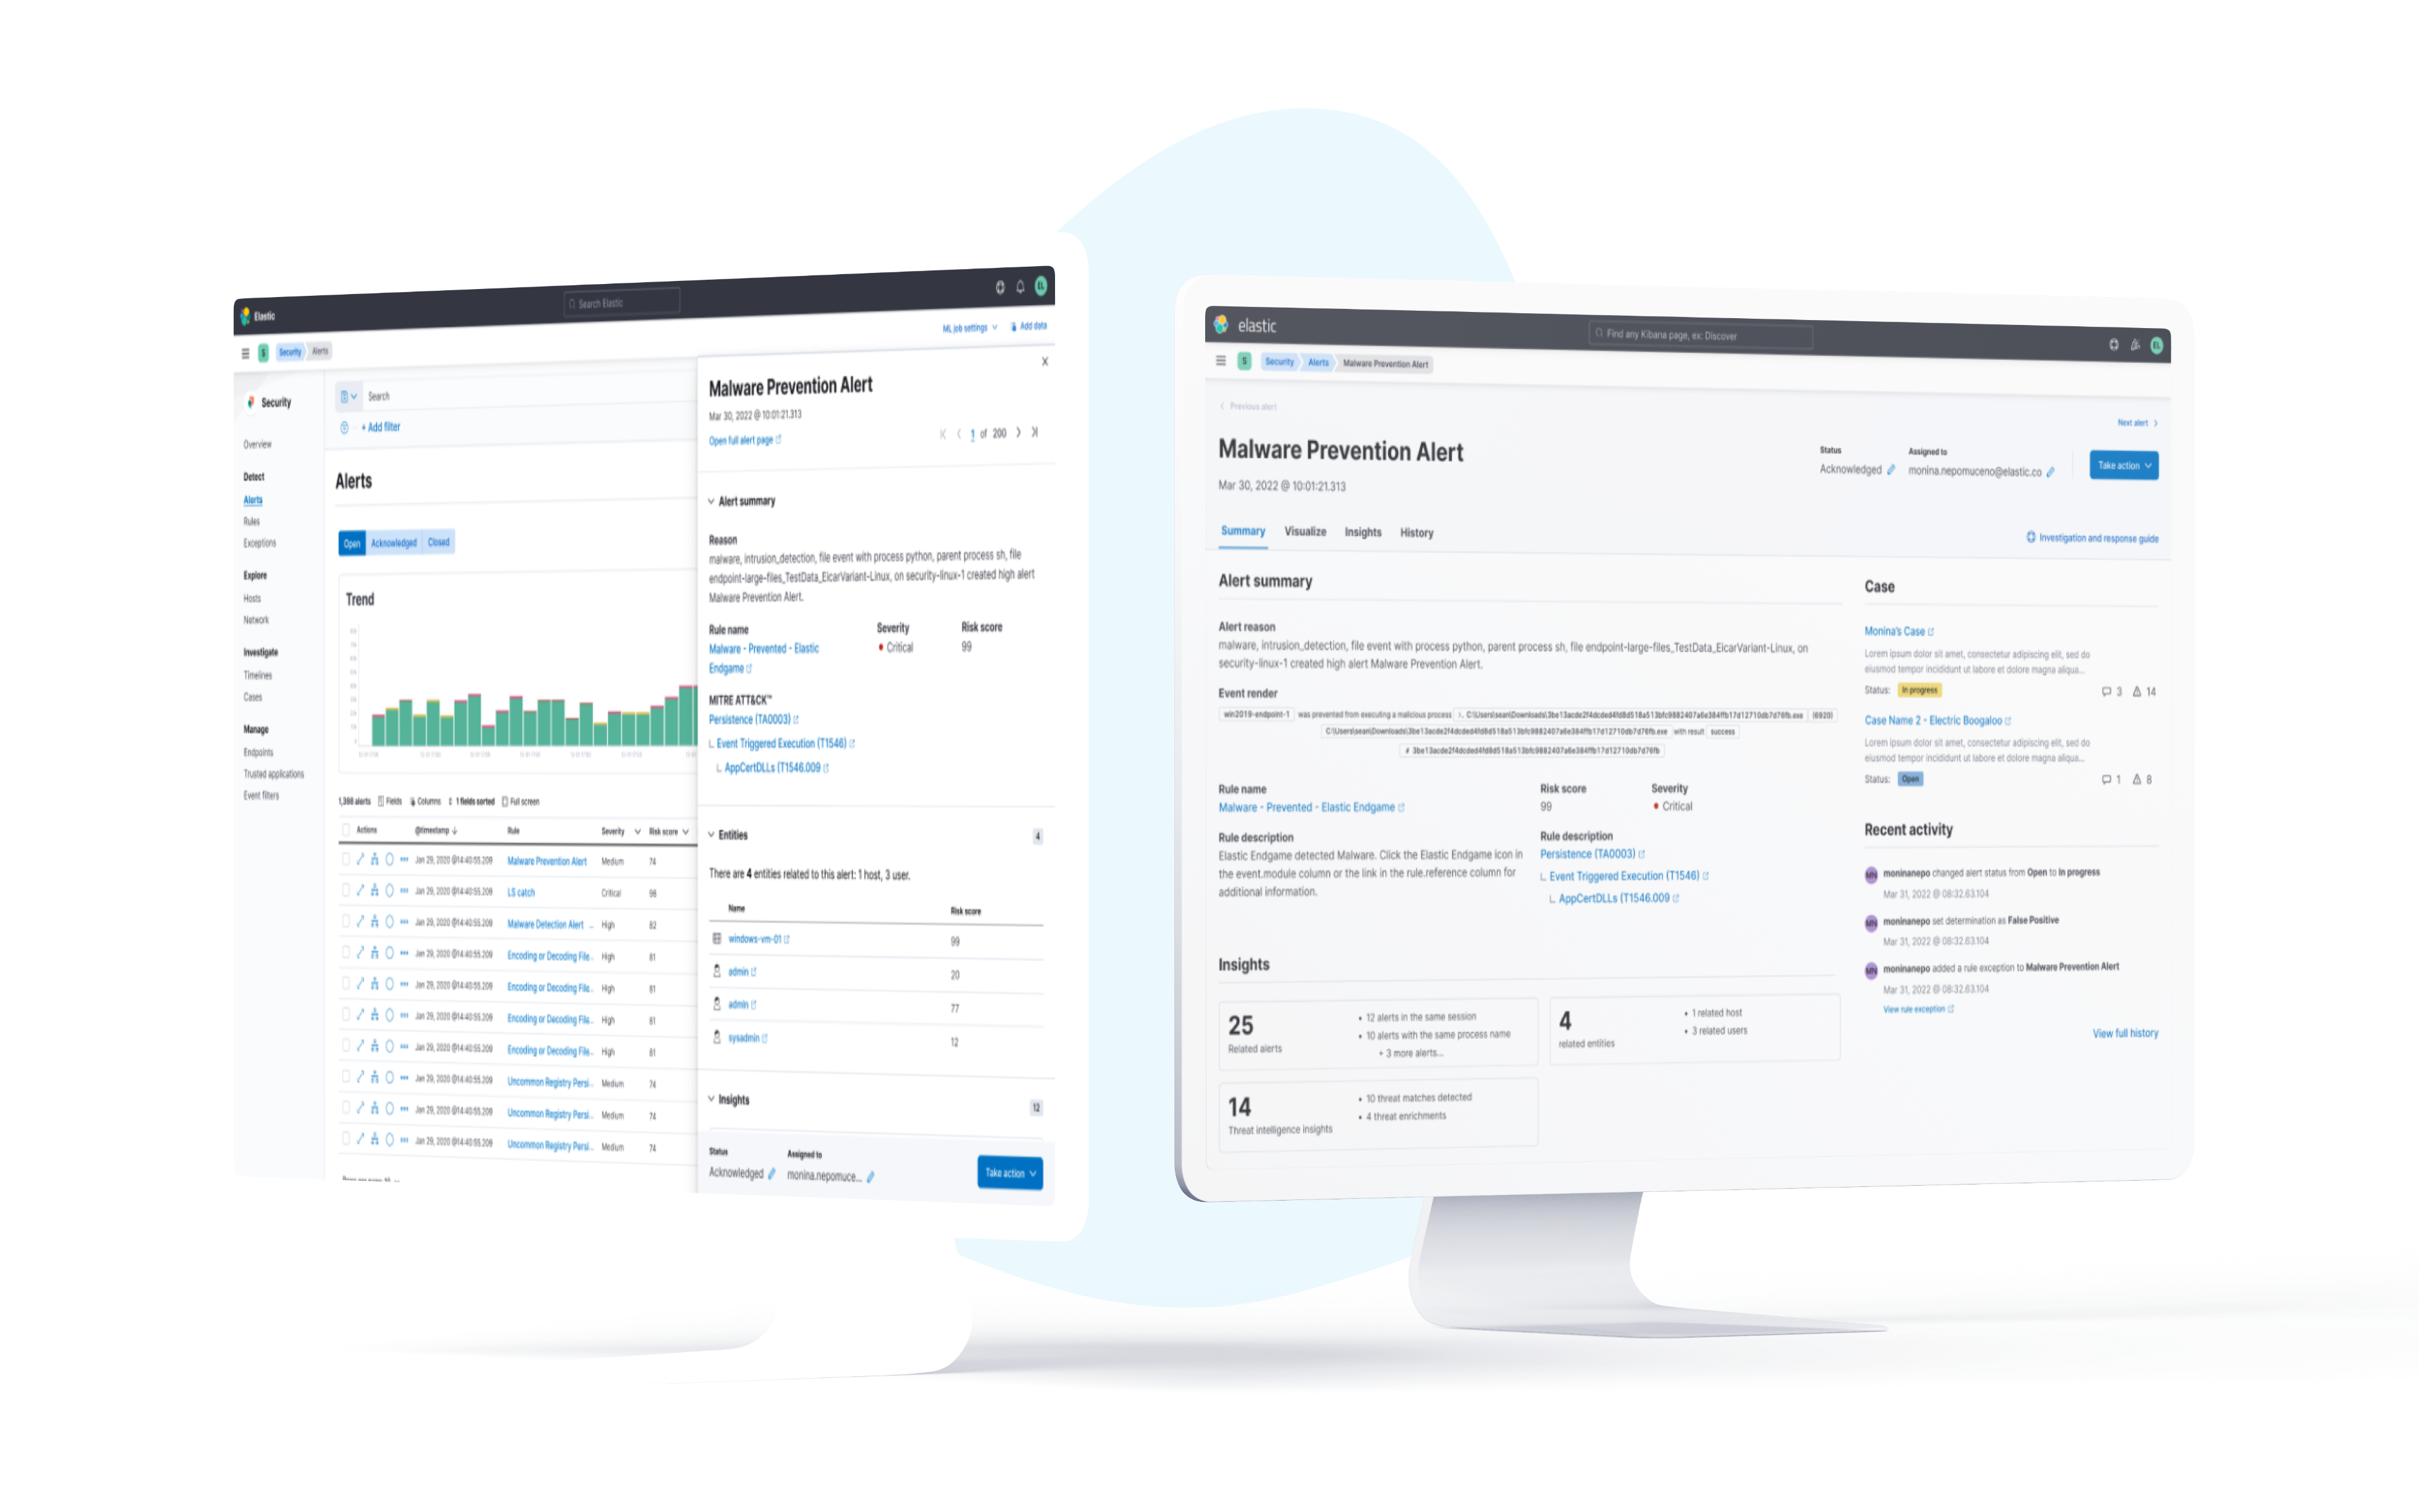
Security Alert InvestigationAlert Details Page Concept
Case Webhook ConnectorComing Soon
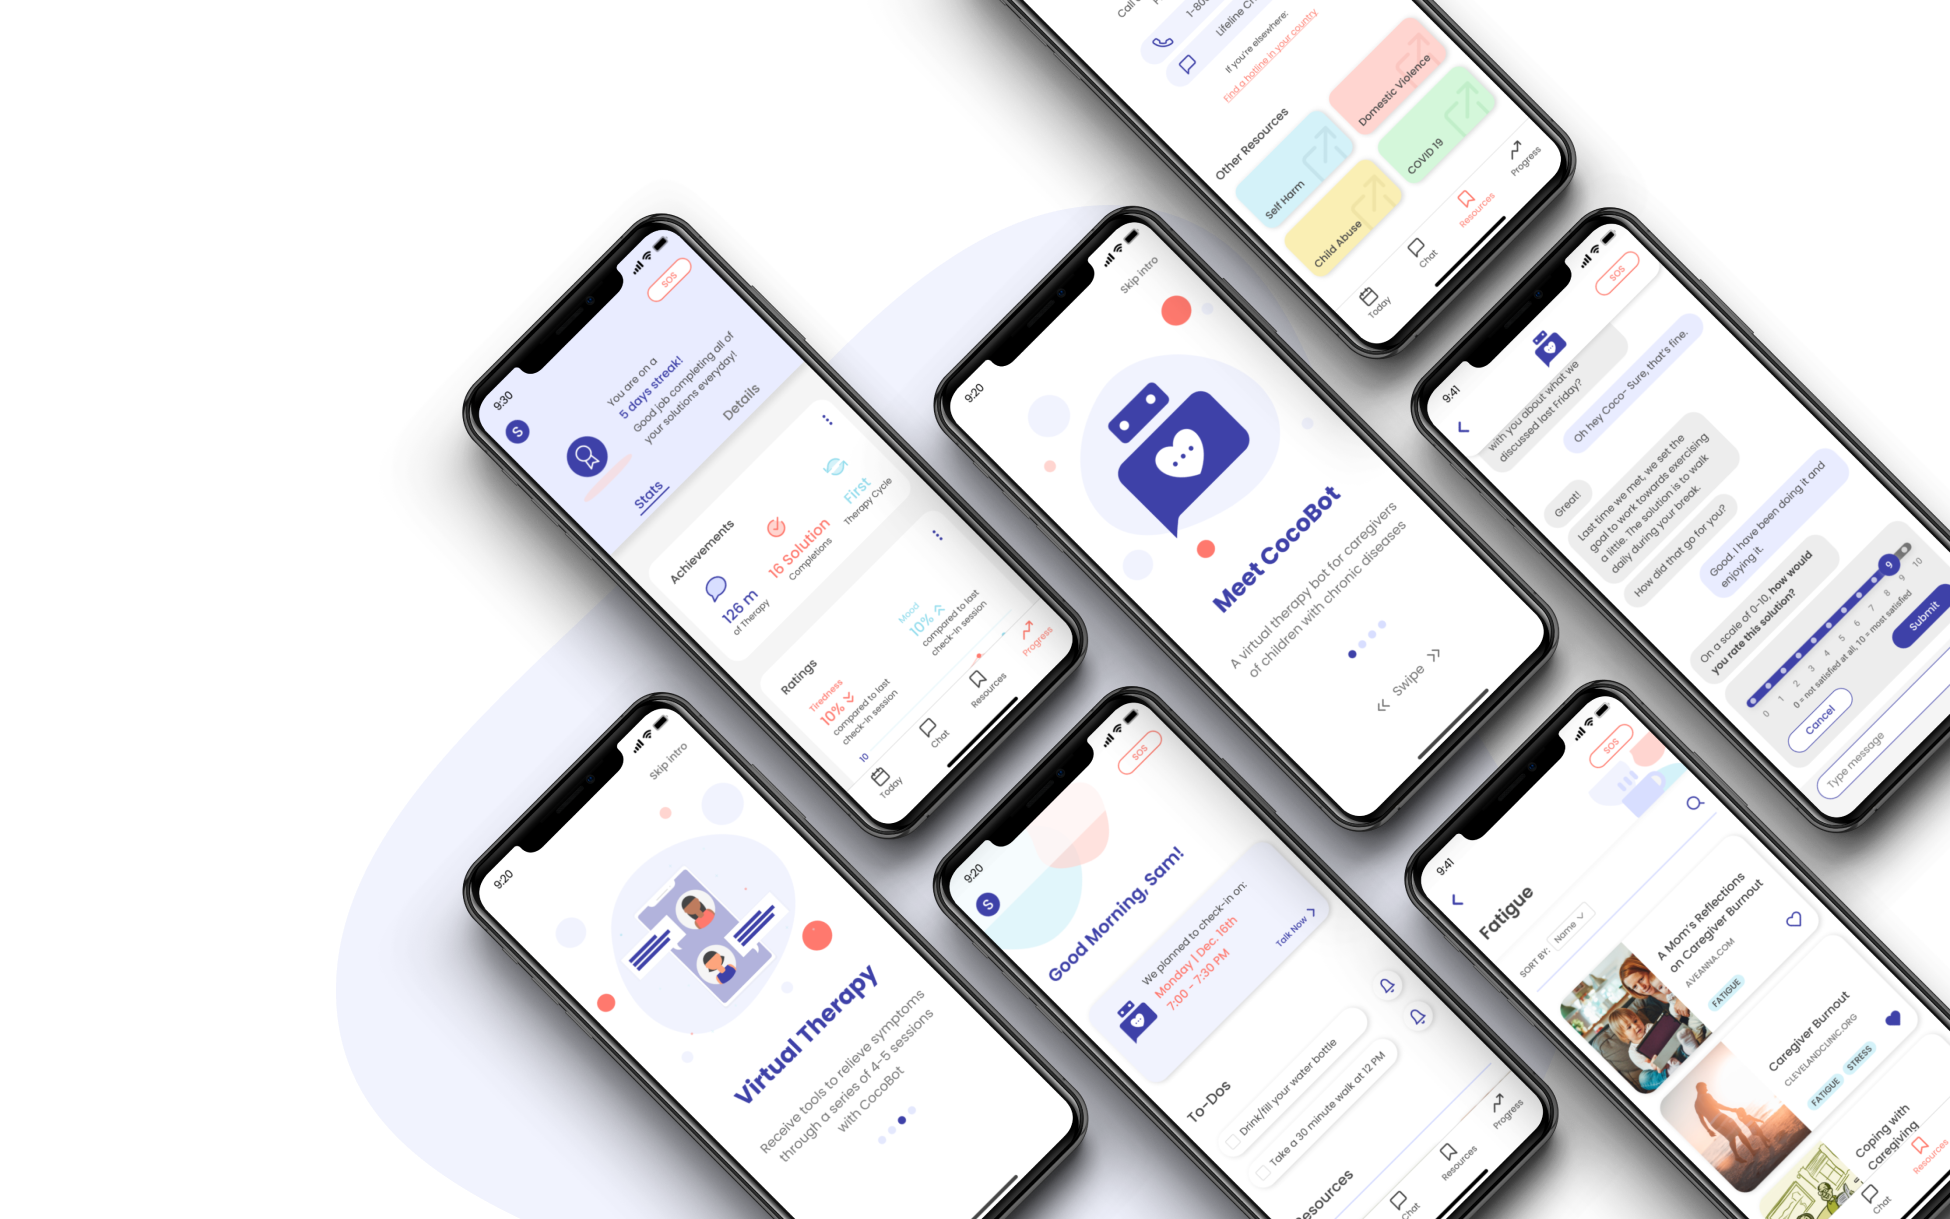
CocoBotMental Health Chatbot
Husky GuideDesign Challenge
How I'm FeelingChildren's Tablet App
© 2022 BY MONINA NEPOMUCENO
